Peer-reviewed research
My academic work spans urban environmental health, computer vision and deep learning for cities, and (in an earlier life) theoretical and particle physics.
All publications
Most recent first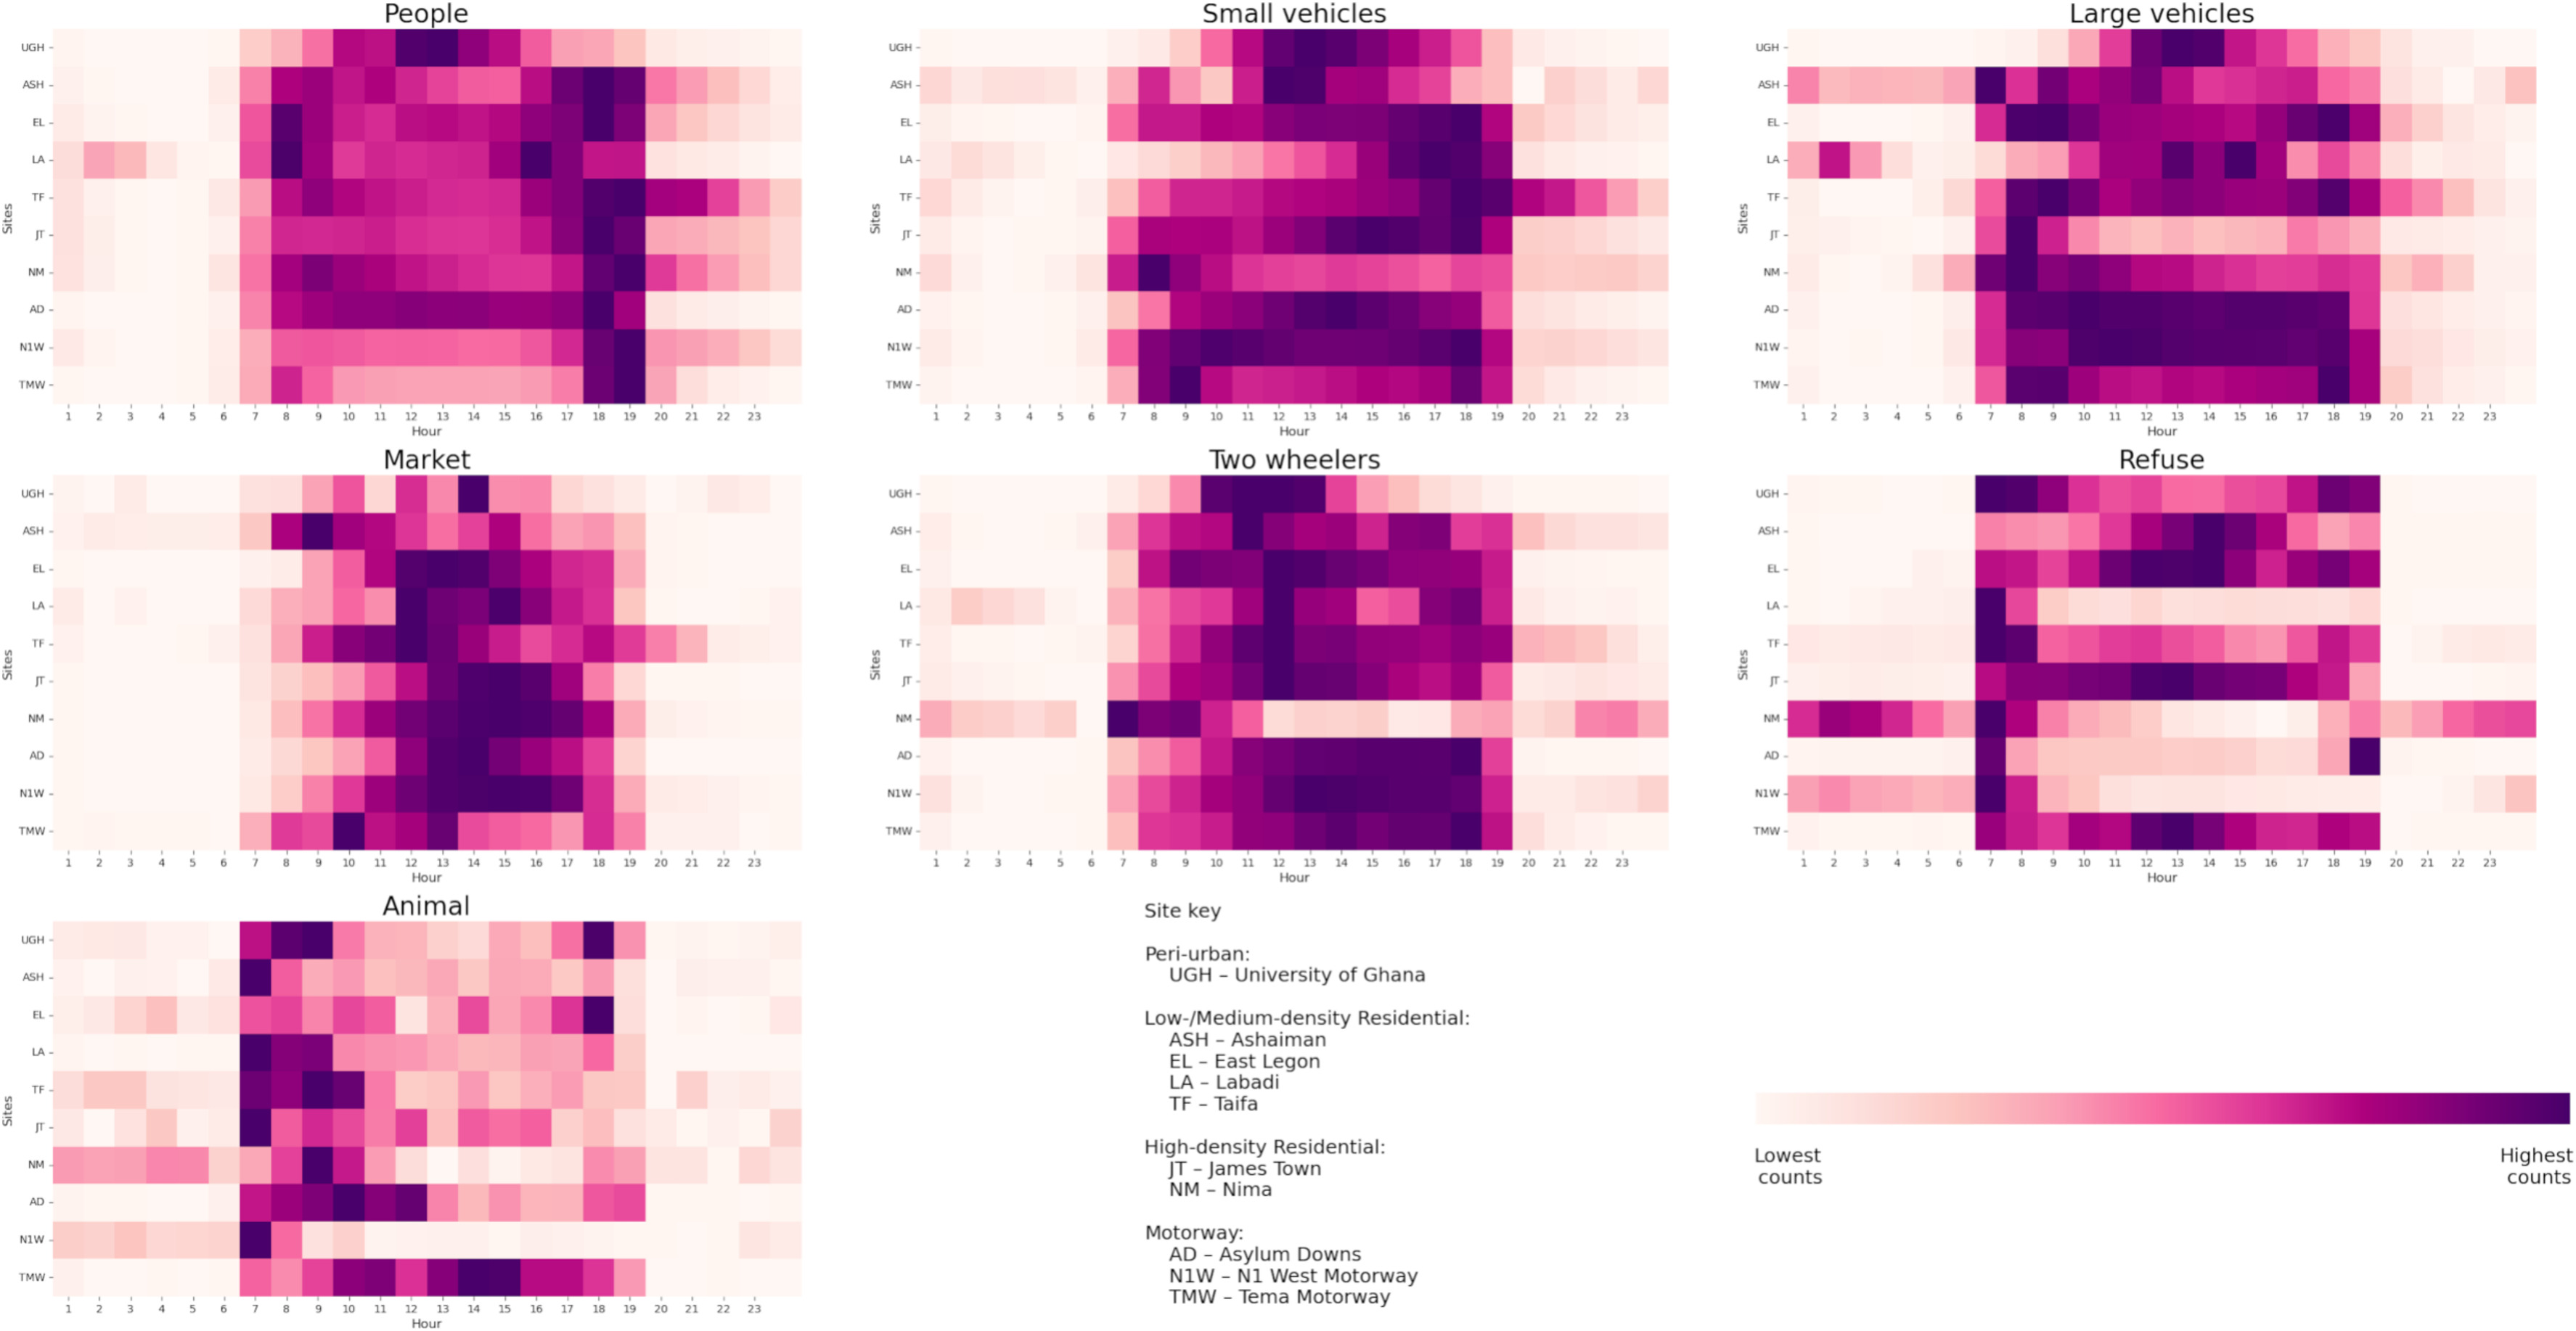 Paper · First author
Capturing urban activities and environment across time scales: Object detection and time-series analysis of 6.8 million images in Accra, Ghana
Paper · First author
Capturing urban activities and environment across time scales: Object detection and time-series analysis of 6.8 million images in Accra, Ghana
Cities
2026
Abstract
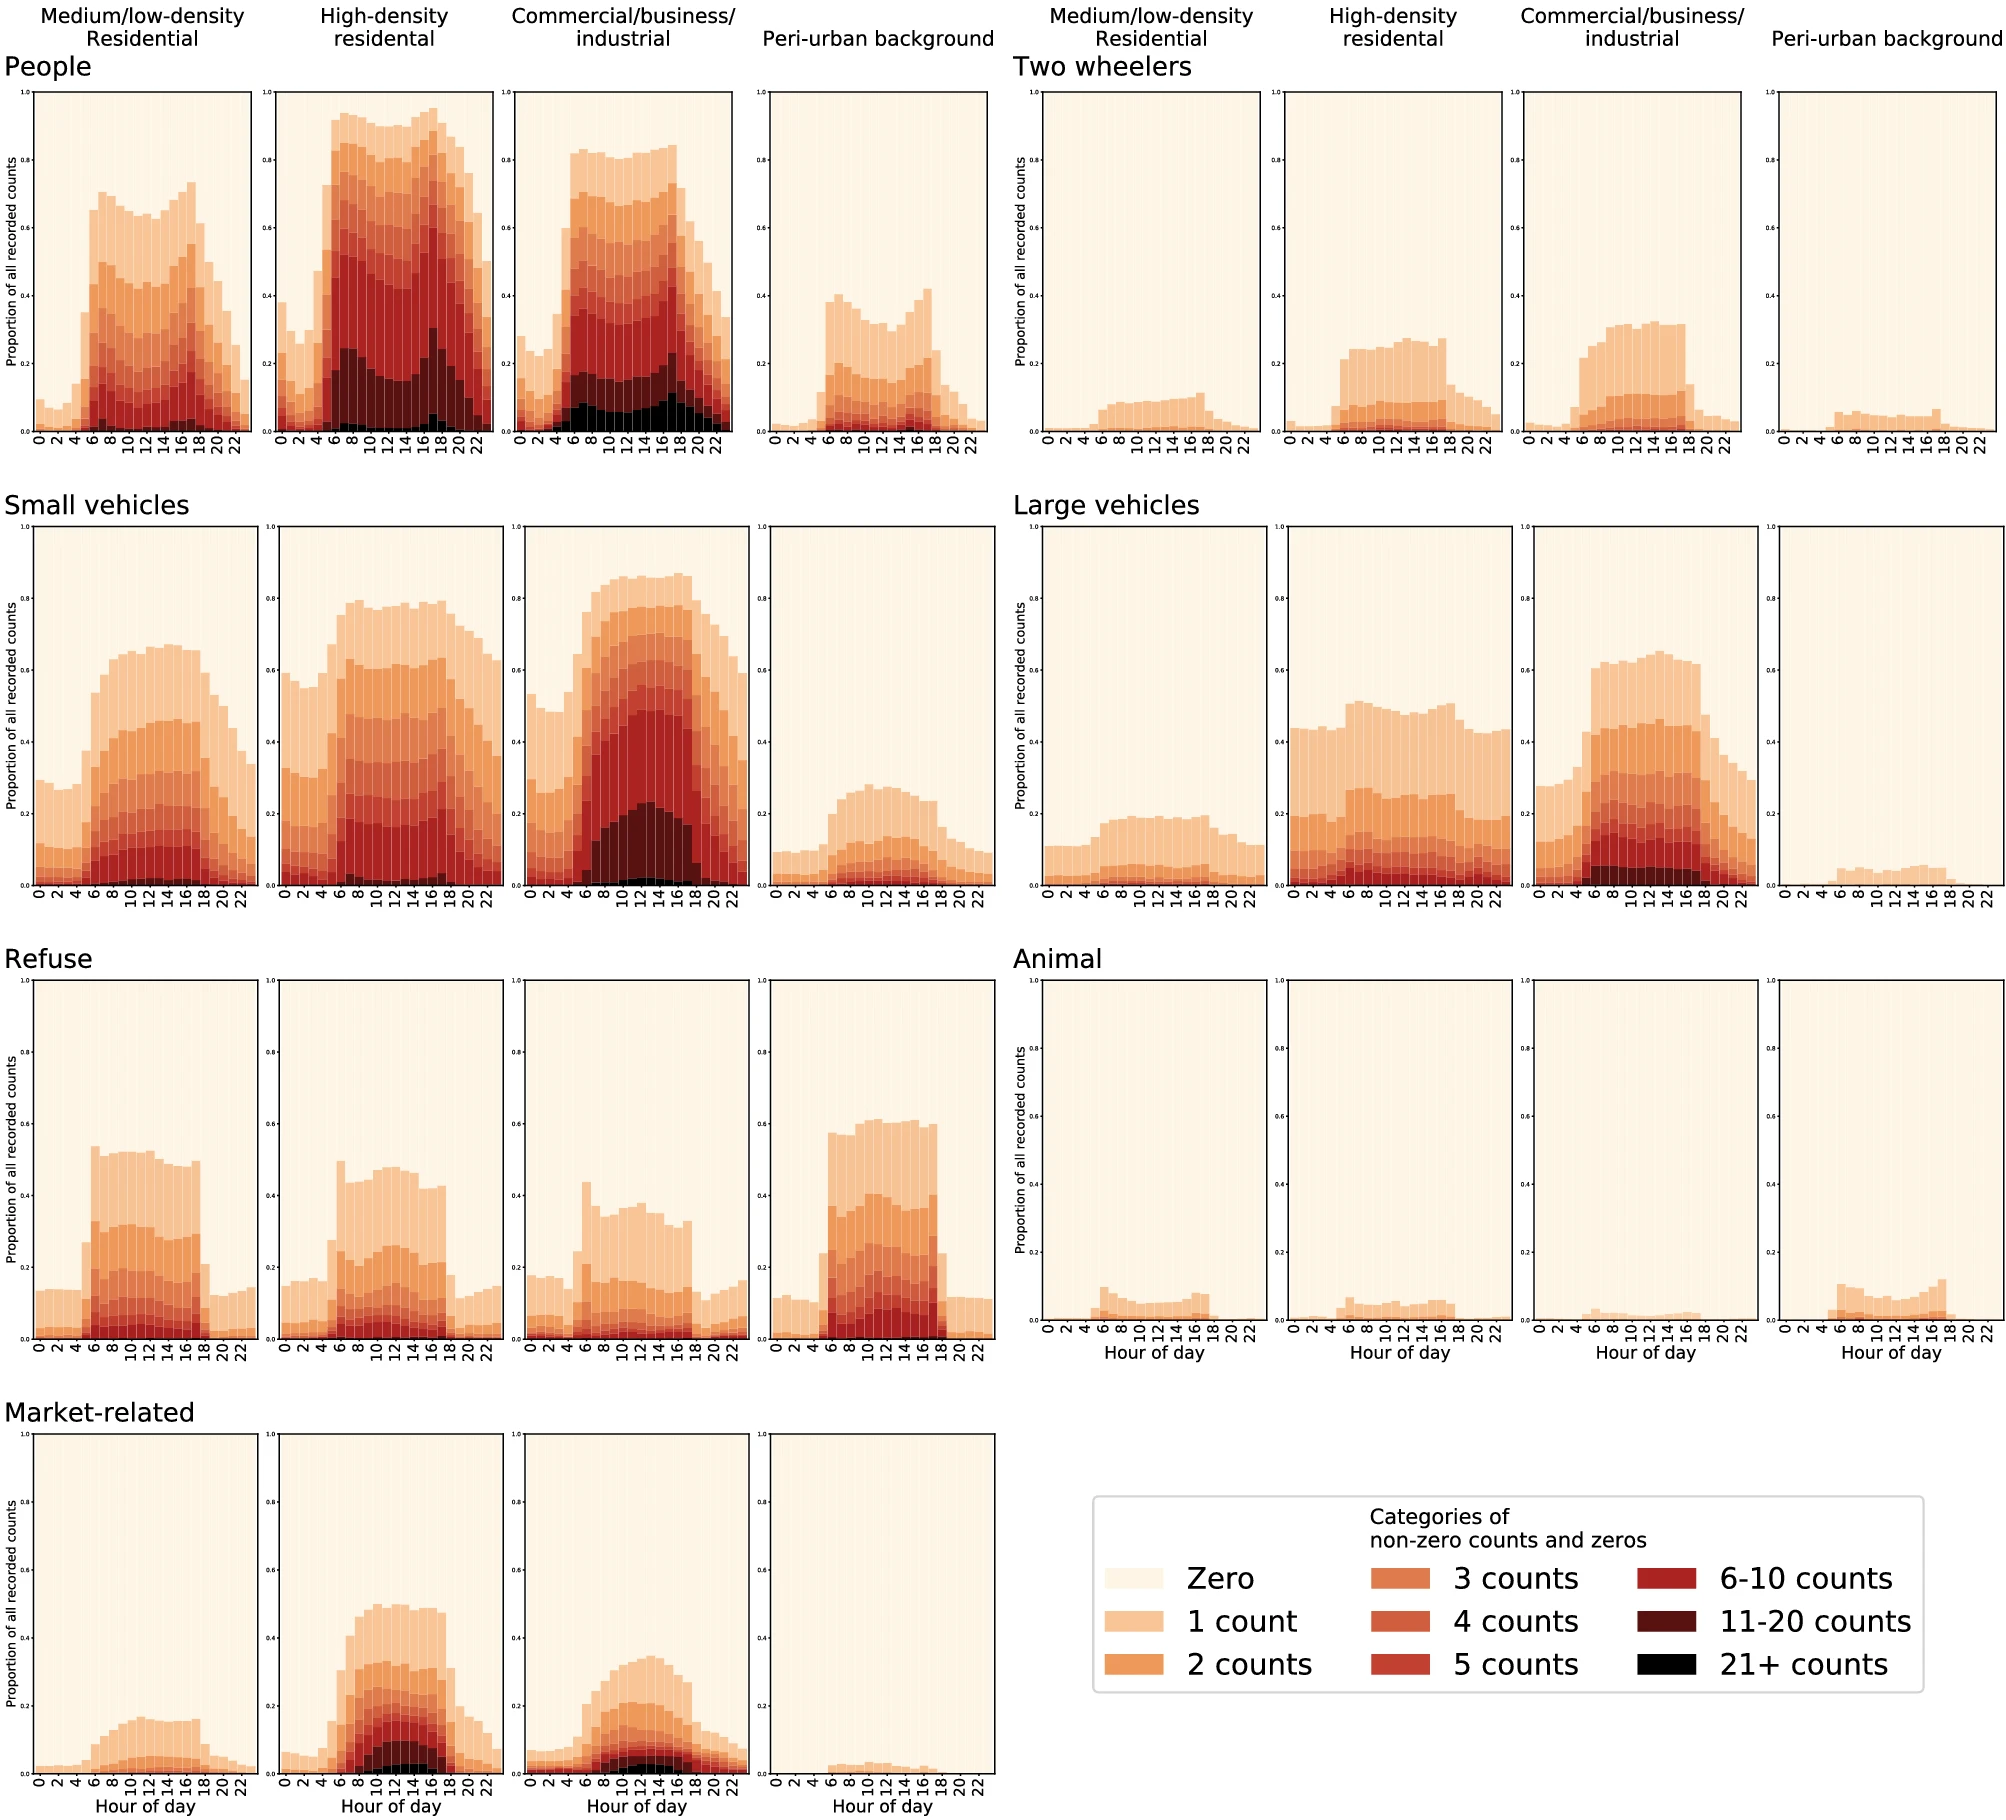
Cities have complex dynamics on timescales from hourly and daily changes to monthly shifts and annual trends. We used time-lapsed street-view imagery (SVI) to capture and analyse temporal trends of urban environmental features in Accra, Ghana. We collected a novel dataset of 6.8 million street-view images (SVI) at five-minute intervals over five years at ten representative locations in Accra, Ghana. We used a fine-tuned YOLOv7 object detection model to detect and obtain counts of people, large vehicles, small vehicles, two-wheelers, market-related objects, refuse and animals in all images. We used a mixed-effects zero-inflated negative binomial model with indicators for hour of day, day of week, week of year, and year to consistently and coherently identify temporal patterns of object counts across time scales and sites. People and small vehicles were most prevalent in mid-morning and early evening, and market-related objects peaked in early afternoon. The number of people, vehicles and market-related objects declined on weekends at most sites, although two residential sites showed an inverse trend, peaking in all three categories on weekends. Long-term trends over the years indicate a rise in people at high-density residential sites. Over the same period, market-related objects, two-wheelers and small vehicles declined at several locations with different land-use characteristics, suggesting broad shifts in transport and commercial activity. These results demonstrate the potential of SVI and computer vision for urban monitoring to support strategies for improving mobility, traffic congestion, pollution, access to goods and services, and waste management.
 Paper
Mobility changes occasioned by COVID-19 lockdown measures: evidence from an emerging economy
Paper
Mobility changes occasioned by COVID-19 lockdown measures: evidence from an emerging economy
TeMA - Journal of Land Use, Mobility and Environment
2025
Abstract
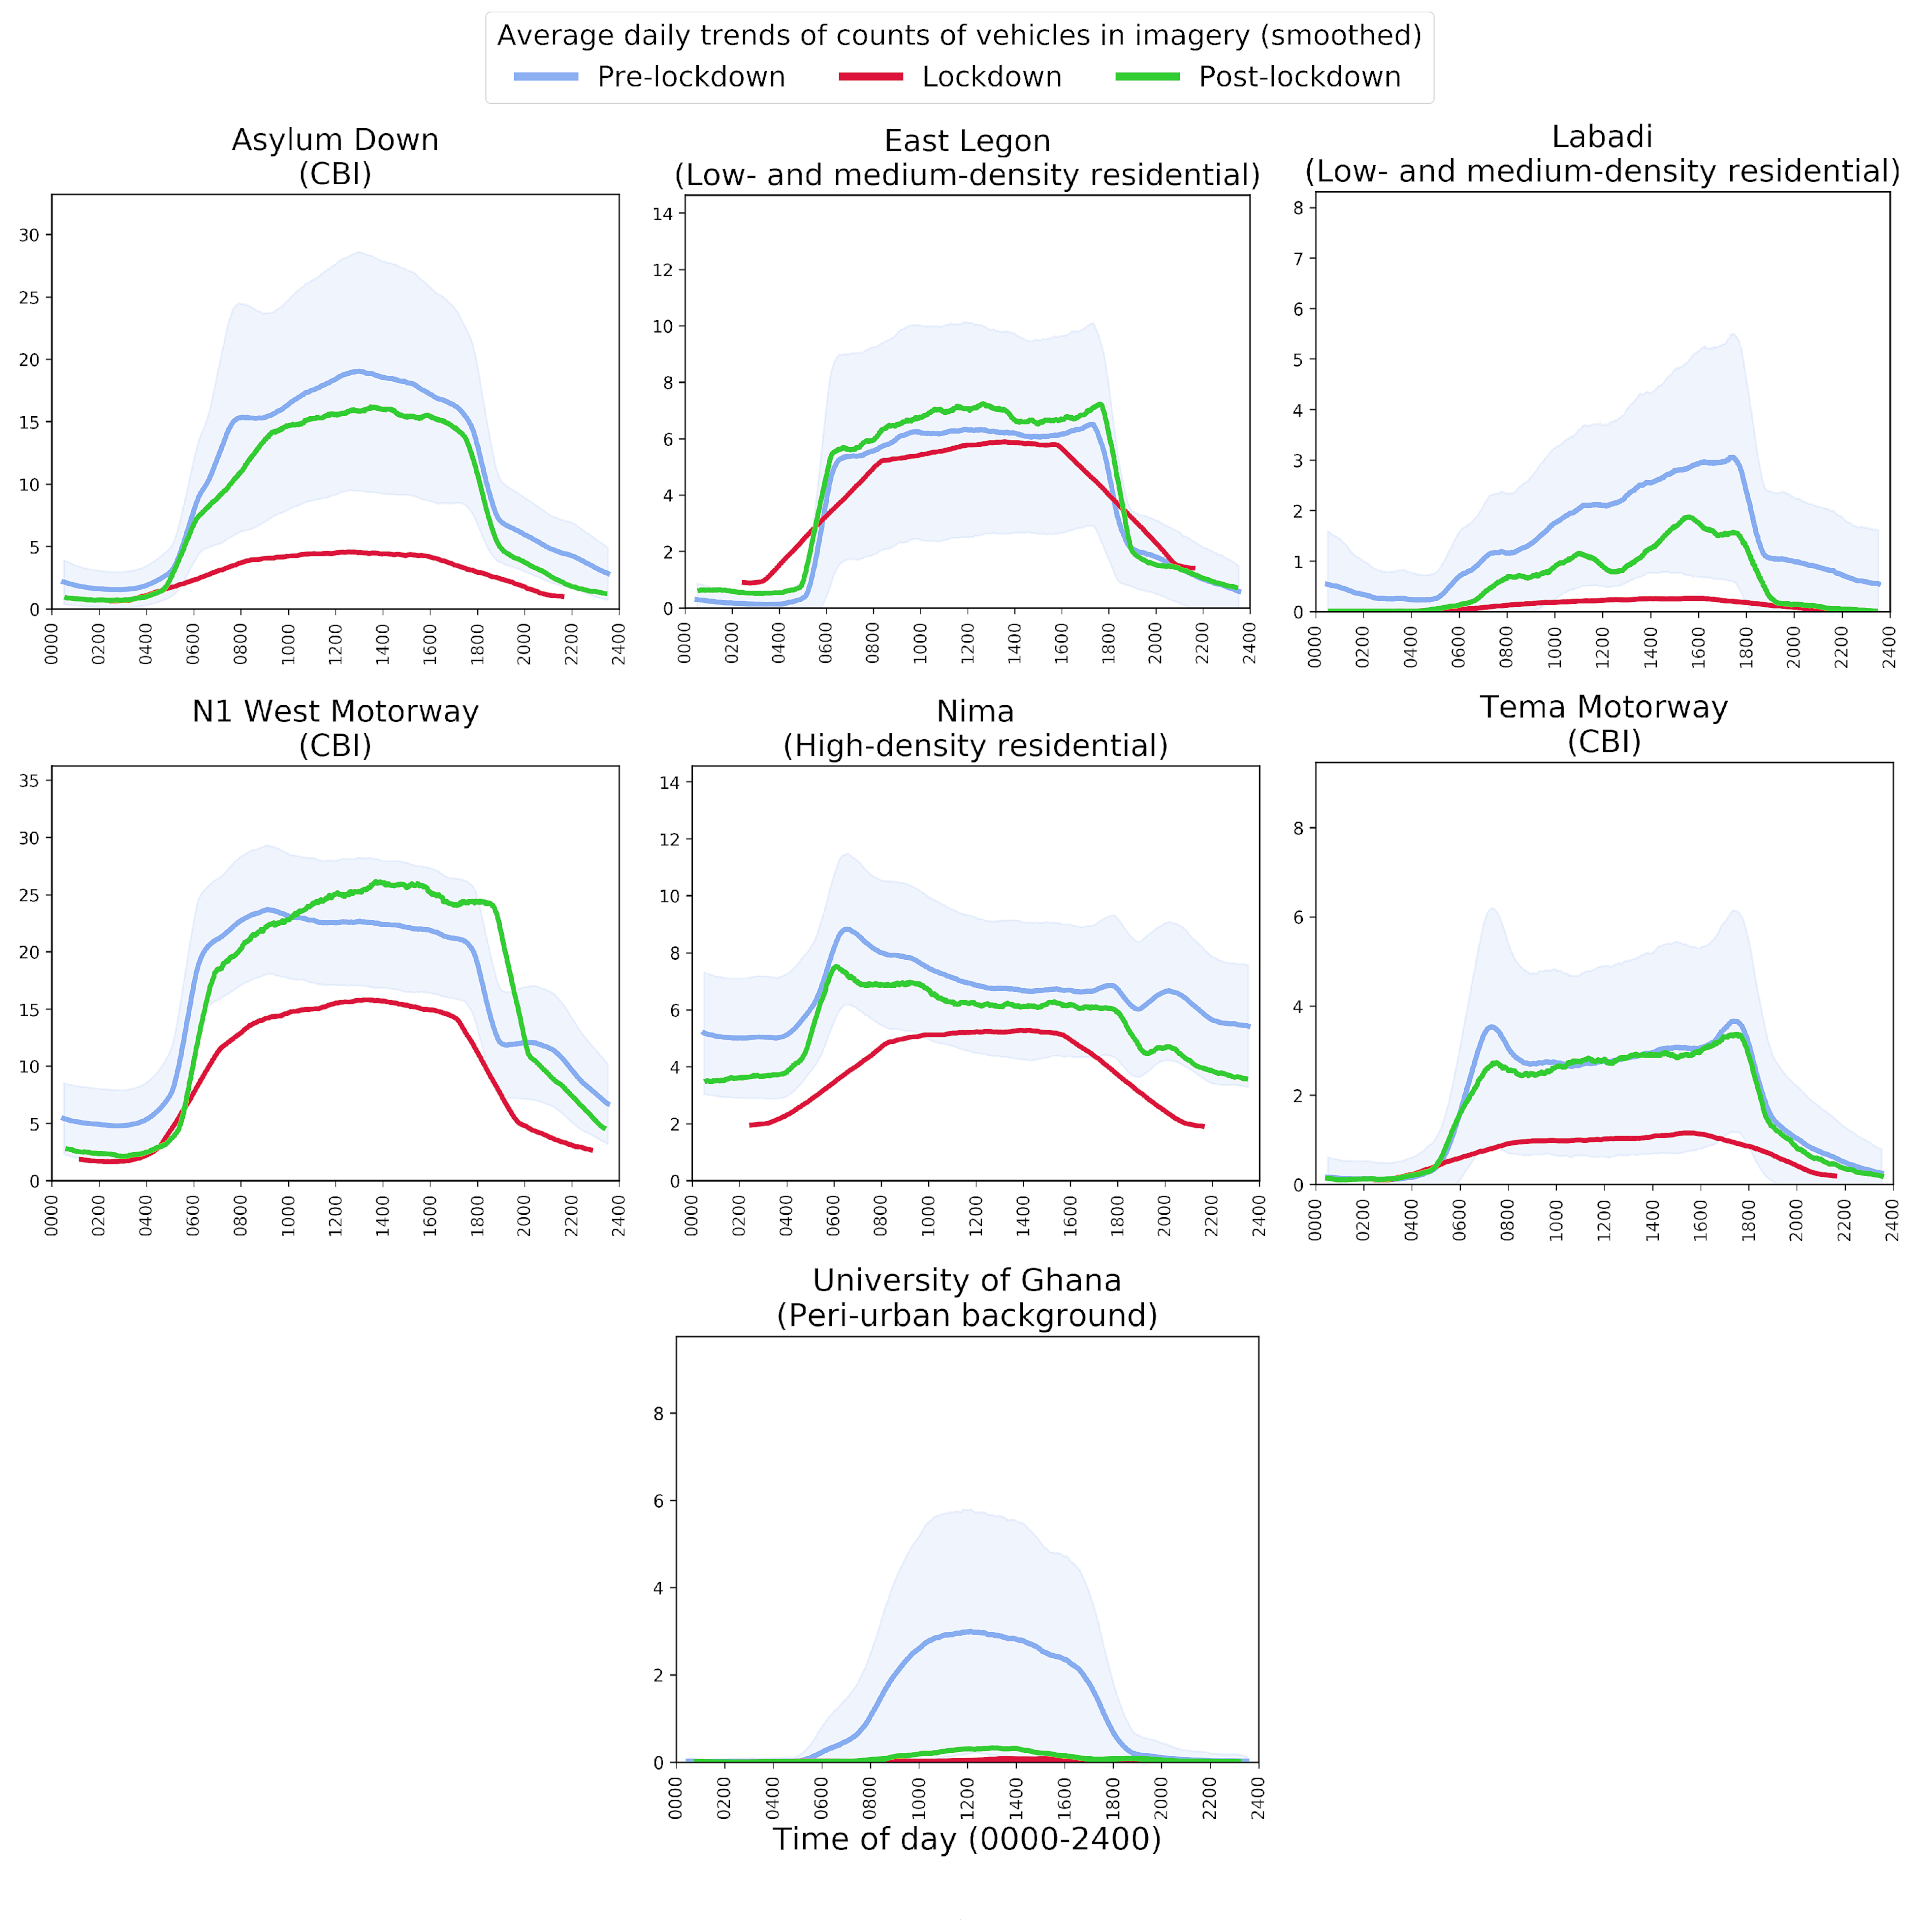
The unprecedented and drastic emergency responses that accompanied the declaration of COVID-19 as a pandemic have highlighted and intensified mobility injustices worldwide. Most of the global interest in the impact of COVID-19 on mobility patterns has come from developed countries, leaving a gap in literature specifically focused on Africa. This paper aims to fill that gap by examining the effects of government-imposed travel restrictions on people's attitudes and mobility behavior in urban Ghana. Using a combination of data sources, including surveys and photographic evidence, we analyze the spatial variations in mobility patterns during the lockdown. Our findings from statistical analyses and time-lapsed images indicate that many young people, informal sector workers, and individuals living in disadvantaged neighborhoods largely ignored the lockdown order. In contrast, most formal sector employees utilized internet-enabled telecommuting, e-learning opportunities, and telephone communications during the lockdown period. The paper concludes with policy recommendations aimed at enhancing mobility justice for all in the face of future public health crises and social emergencies that may require physical mobility restrictions.
 Paper
Unsupervised deep clustering of high-resolution satellite imagery reveals phenotypes of urban development in Sub-Saharan Africa
Paper
Unsupervised deep clustering of high-resolution satellite imagery reveals phenotypes of urban development in Sub-Saharan Africa
Science of The Total Environment
2025
Abstract
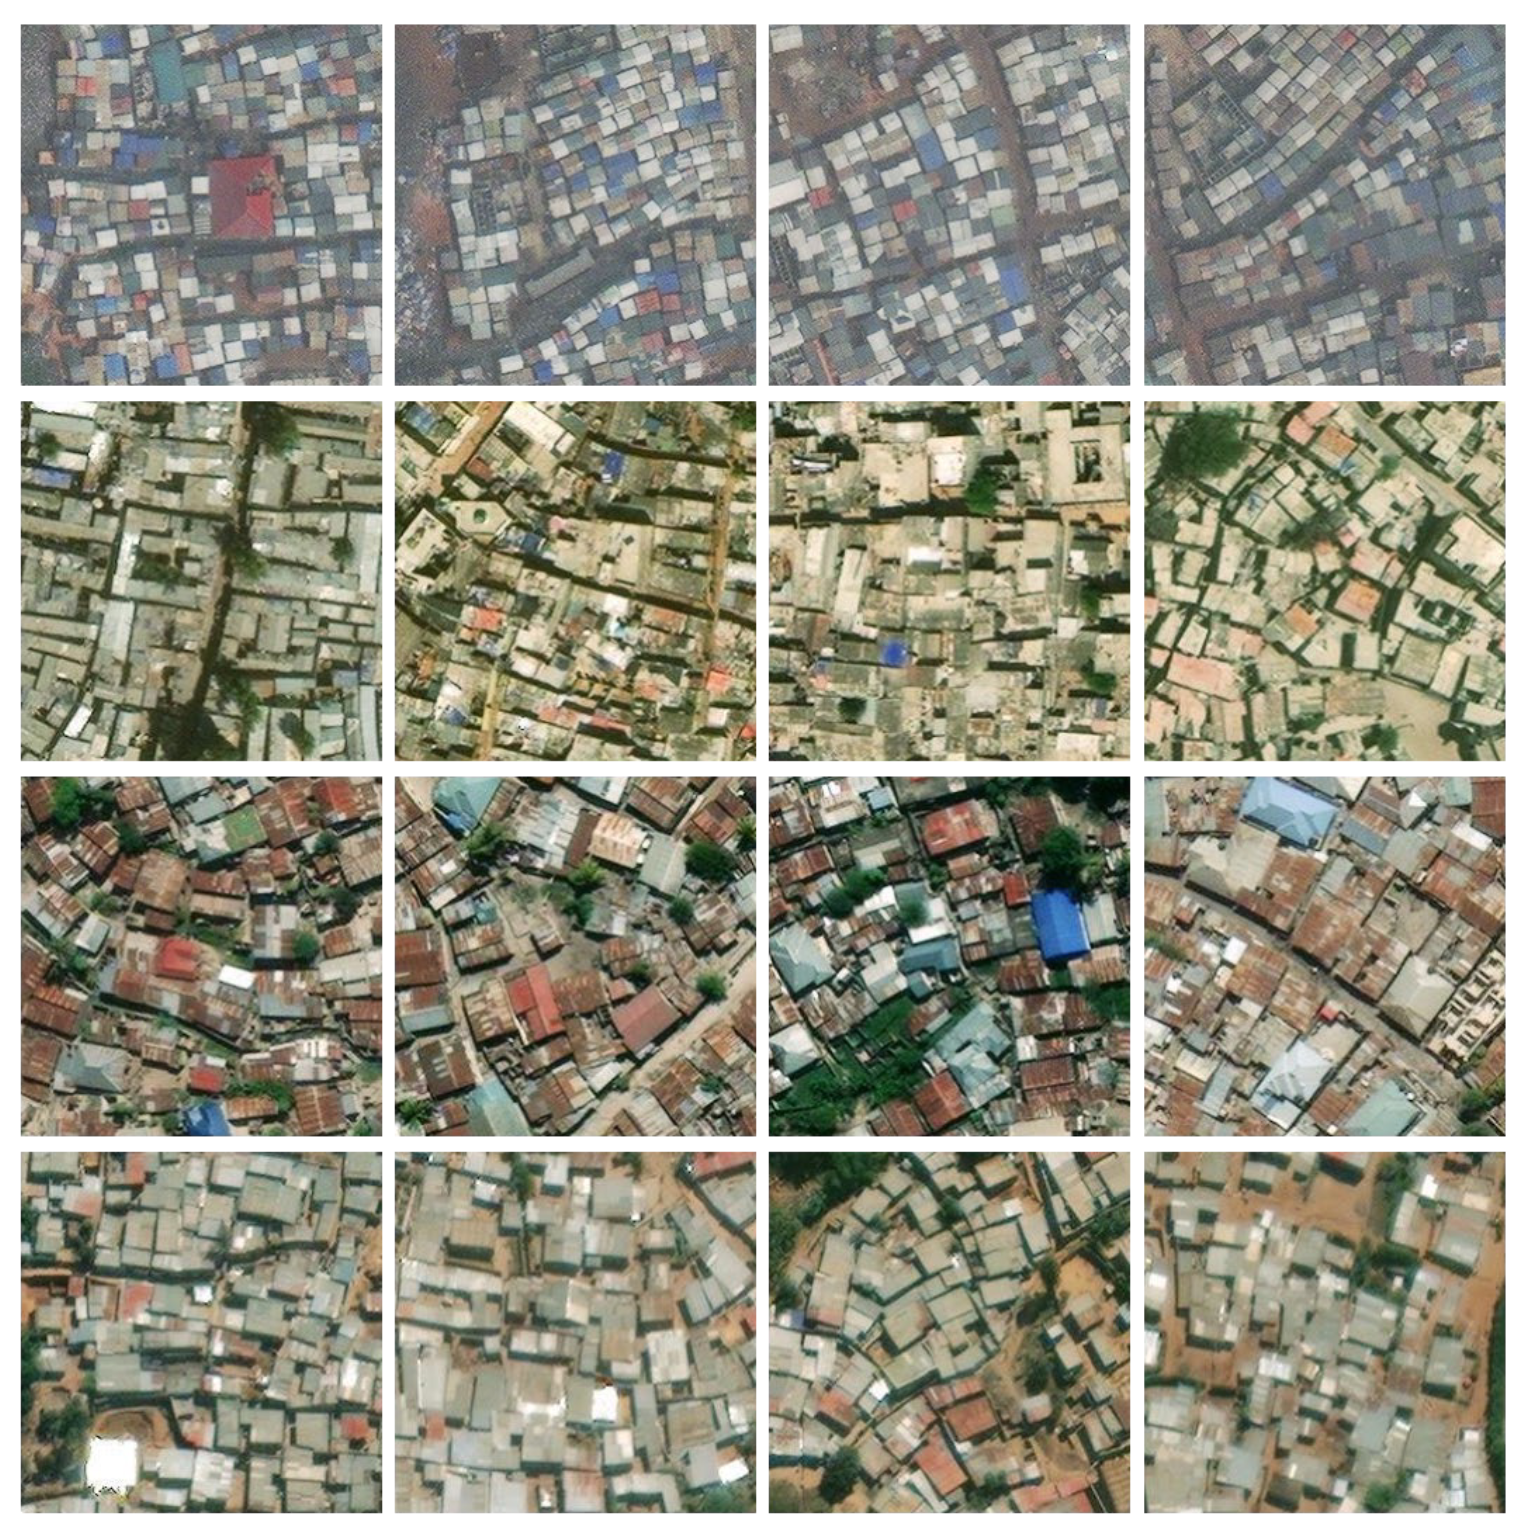
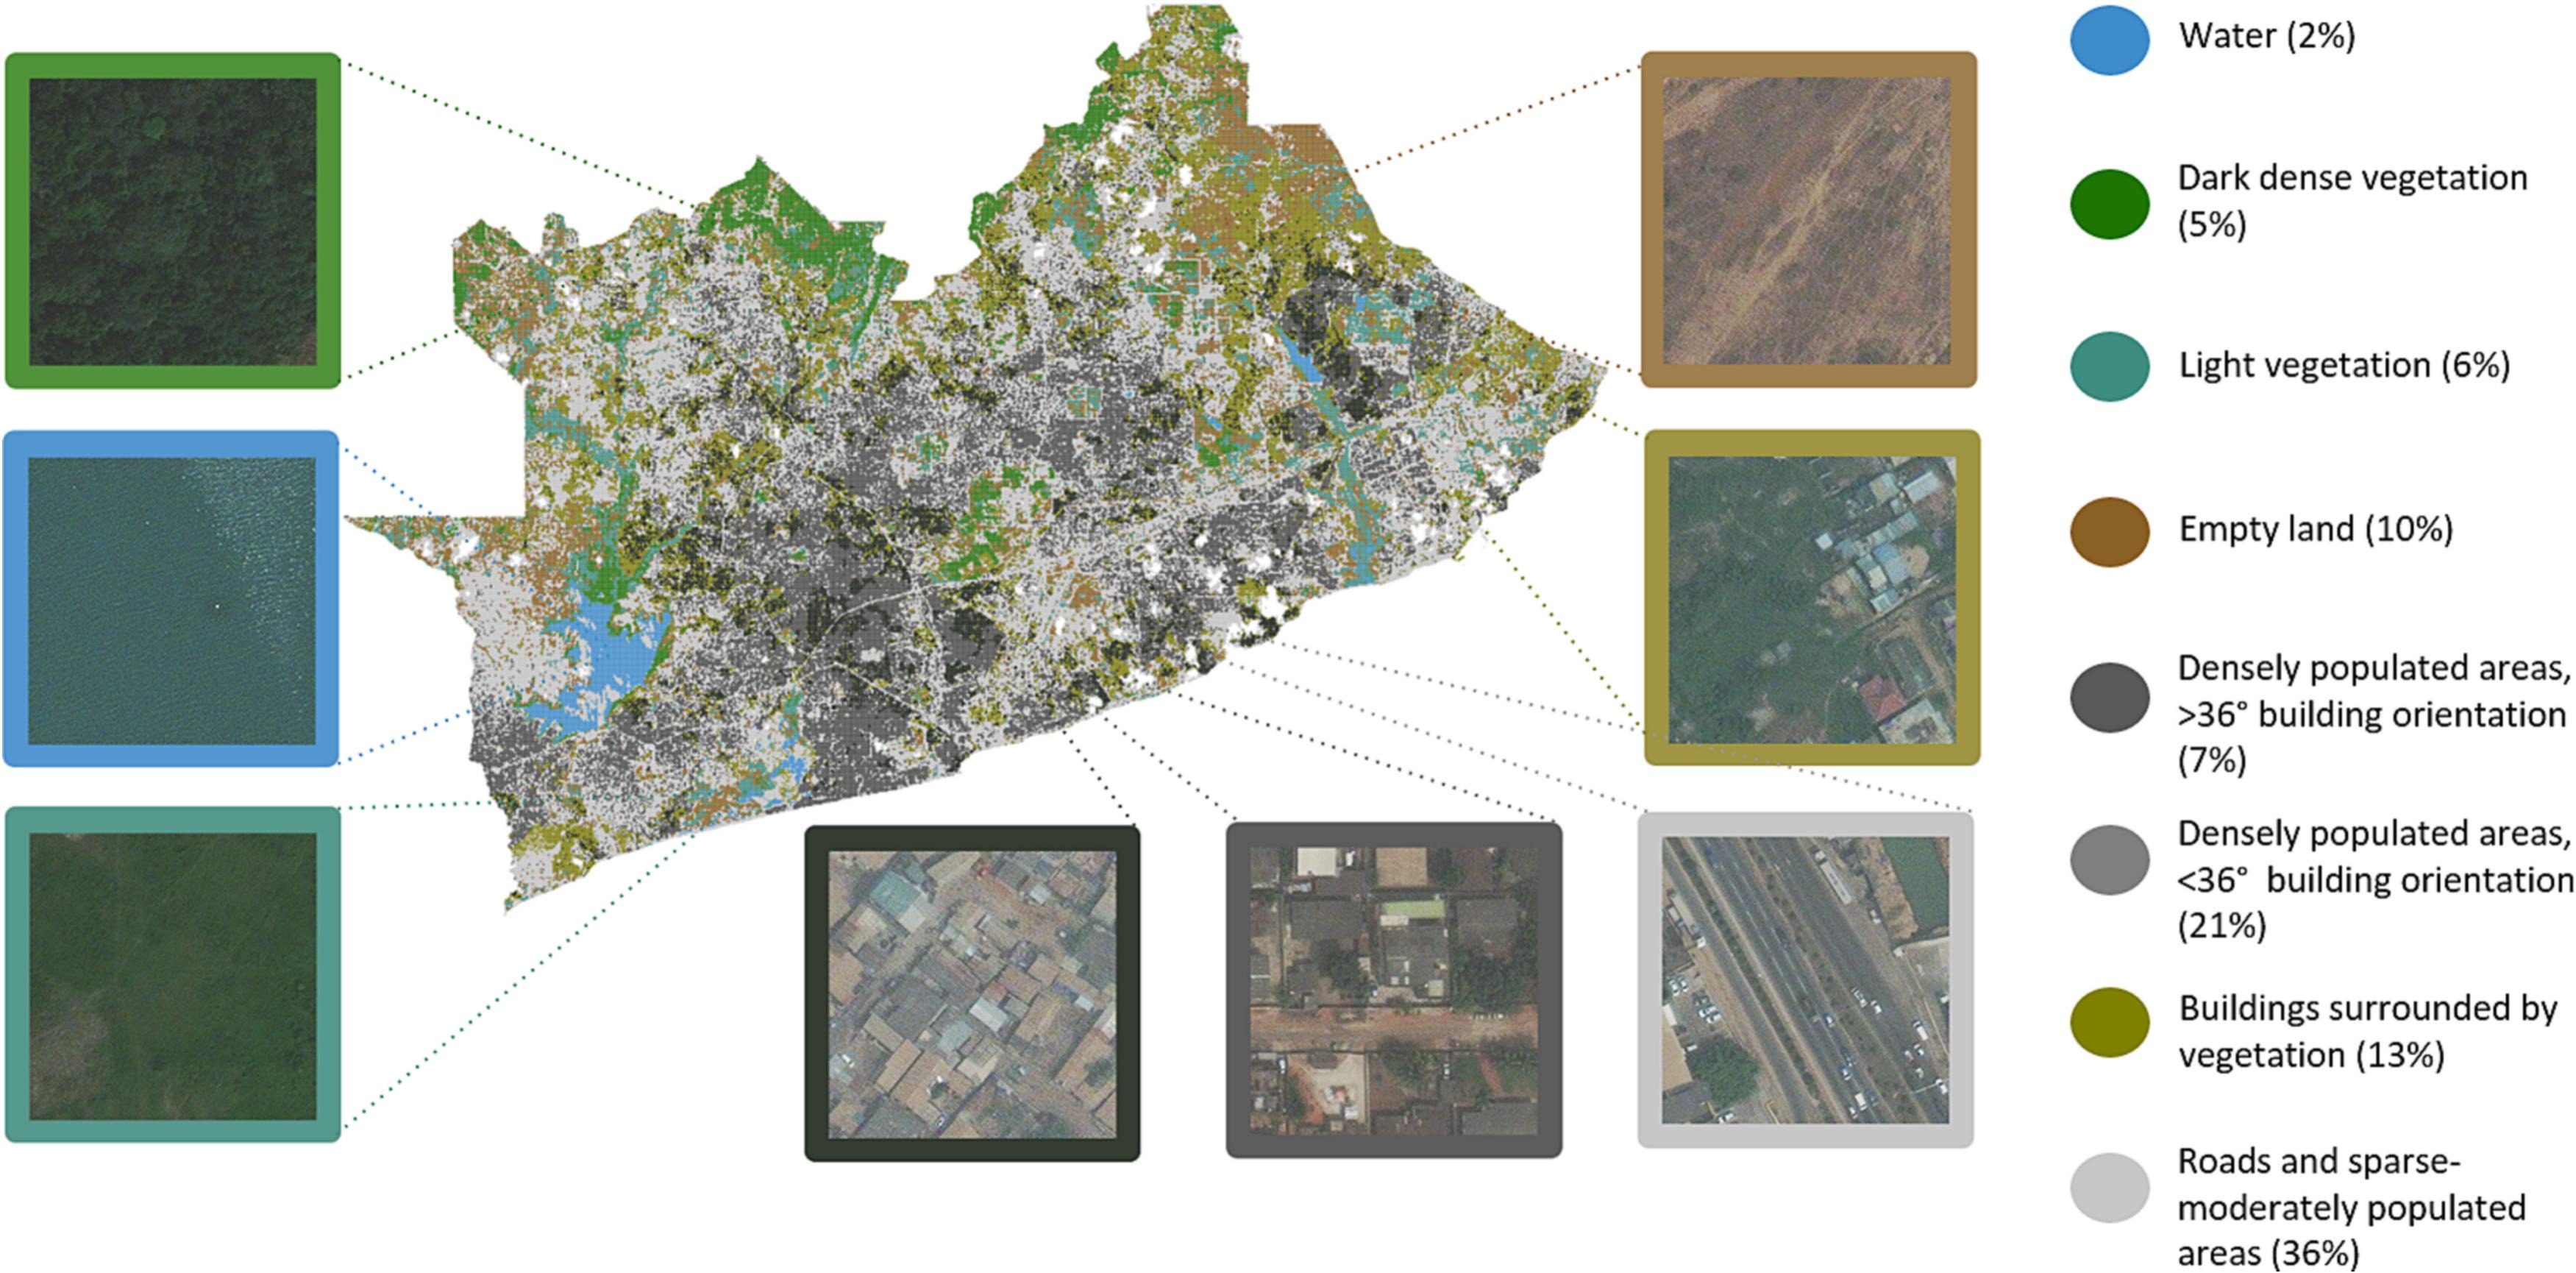
Sub-Saharan Africa and other developing regions have urbanized extensively, leading to complex urban features with varying presence and types of roads, buildings and vegetation. We use a novel hierarchical deep learning framework and high-resolution satellite images to characterize multidimensional urban environments in multiple cities. Application of the model to images from Accra, Dakar, and Dar es Salaam identified areas with analogous patterns of building density, roads and vegetation. These included dense settlements within the metropolitan boundary (20–54% of urban area), peri-urban intermix of natural and built environment (21–44%), natural vegetation (9–13%) and agricultural land (8–15%). Kigali, with its mountainous geography and post-colonial expansion, exhibited unique urban characteristics including a sparser urban core (23%) and significant wildland-urban intermix (19% of vegetation). Other notable clusters were water (2% of area of Accra) and empty land (8–10% of Accra and Dakar). Our results demonstrate that unlabeled satellite images with unsupervised deep learning can be used for consistent and coherent near-real-time urban monitoring, particularly in regions where traditional data are scarce.
 Paper
Moving beyond the noise: geospatial modelling of urban sound environments in a sub-Saharan African city
Paper
Moving beyond the noise: geospatial modelling of urban sound environments in a sub-Saharan African city
Scientific Reports
2025
Abstract
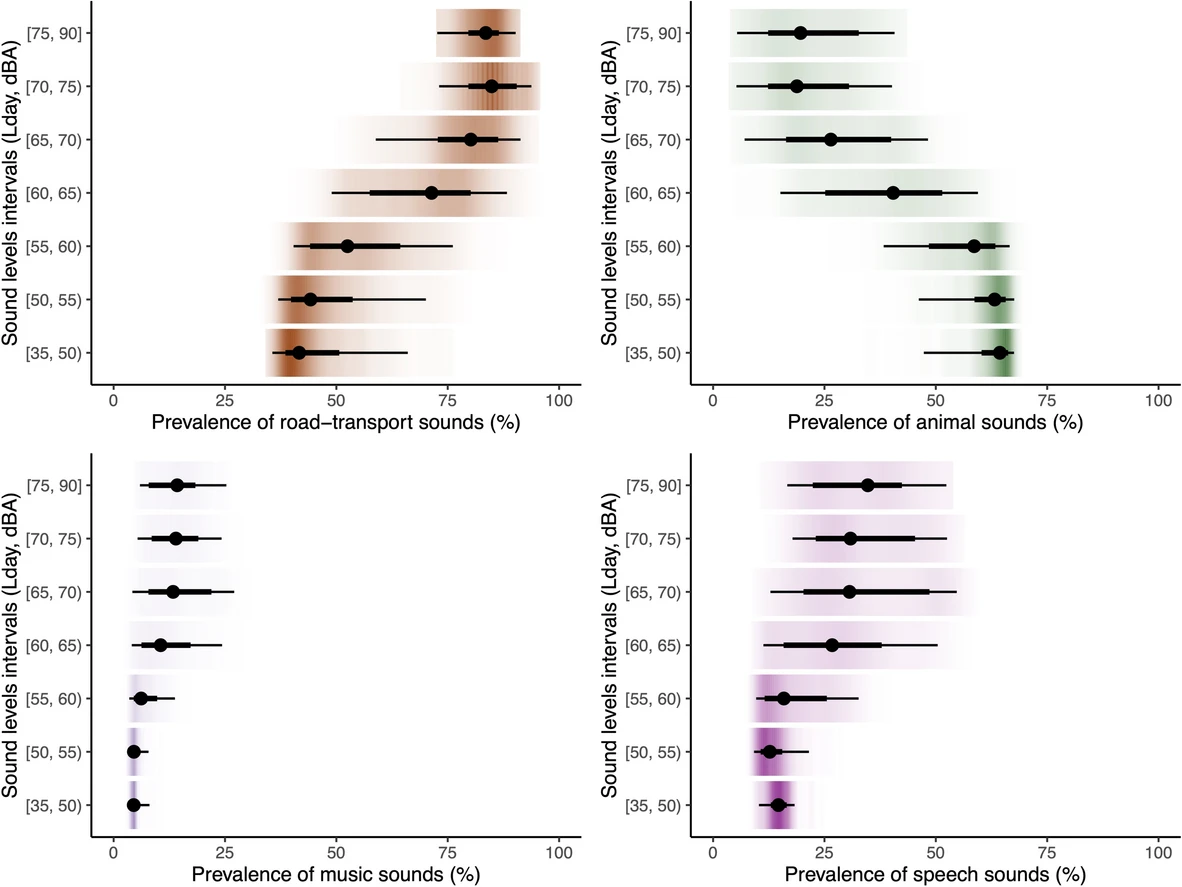
Cities encompass a mixture of artificial, human, animal, and nature-based sounds, which through long and short-term exposures, can impact on physical and mental health. Yet, most epidemiological research has focused on only transportation noise, leaving a significant gap in understanding the health impacts of other urban sound types, especially in sub-Saharan Africa (SSA). We conducted a large-scale measurement campaign in Accra, Ghana, collecting audio recordings and sound levels from 129 locations between April 2019-June 2020. We classified sound types with a neural network model and then used Random Forest land use regression to predict prevalences of different sound types citywide. We then developed a composite metric integrating sound levels with the prevalence of sound types. Road traffic sounds dominated the urban core, while human and animal sounds were prominent in high-density and peri-urban areas, respectively. Our high-resolution approach provides a comprehensive characterization of the complexity of urban sounds in a major SSA city, paving the way for new epidemiological studies on the health impacts of exposure to diverse sound sources in the future.
 Paper · First author
Measurement of urban vitality with time-lapsed street-view images and object-detection for scalable assessment of pedestrian-sidewalk dynamics
Paper · First author
Measurement of urban vitality with time-lapsed street-view images and object-detection for scalable assessment of pedestrian-sidewalk dynamics
ISPRS Journal of Photogrammetry and Remote Sensing
2025
Abstract
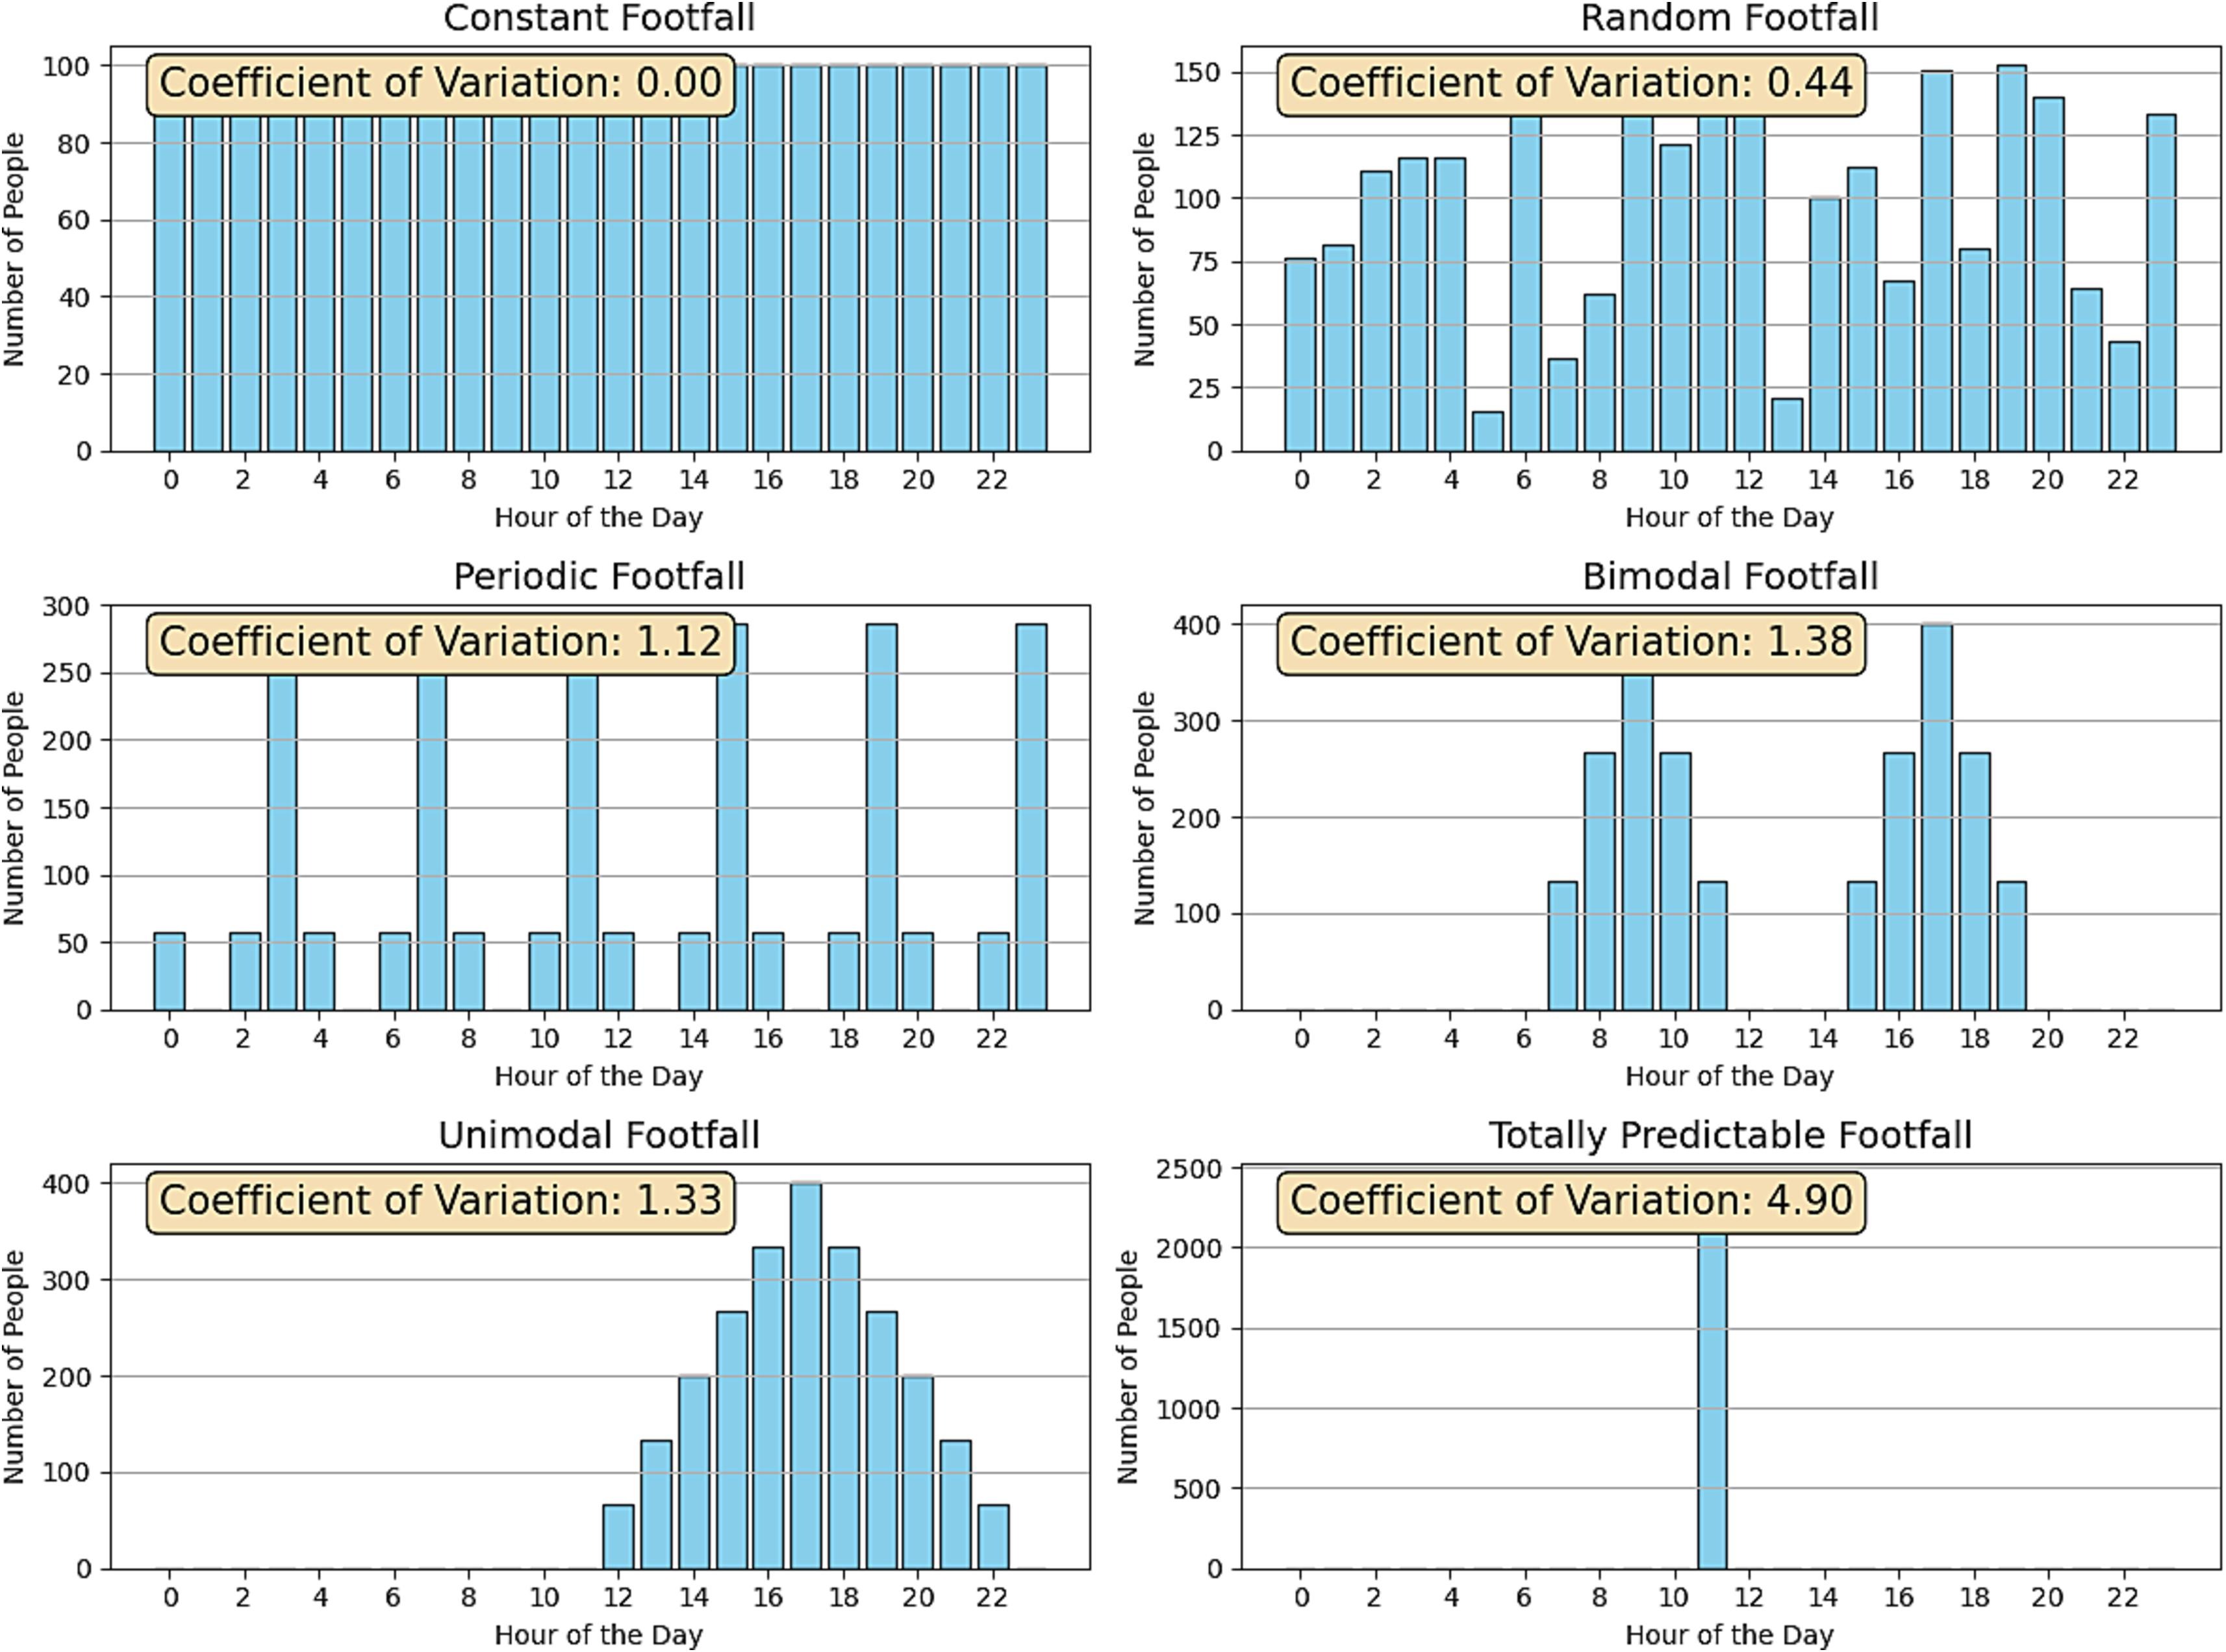
Principles of dense, mixed-use environments and pedestrianisation are influential in urban planning practice worldwide. A key outcome espoused by these principles is generating “urban vitality”, the continuous use of street sidewalk infrastructure throughout the day, to promote safety, economic viability and attractiveness of city neighbourhoods. Vitality is hypothesised to arise from a nearby mixture of primary uses, short blocks, density of buildings and population and a diversity in the age and condition of surrounding buildings. To investigate this claim, we use a novel dataset of 2.1 million time-lapsed day and night images at 145 representative locations throughout the city of Accra, Ghana. We developed a measure of urban vitality for each location based on the coefficient of variation in pedestrian volume over time in our images, obtained from counts of people identified using object detection. We also construct measures of “generators of diversity”: mixed-use intensity, building, block and population density, as well as diversity in the age of buildings, using data that are available across multiple cities and perform bivariate and multivariate regressions of our urban vitality measure against variables representing generators of diversity to test the latter’s association with vitality. We find that two or more unique kinds of amenities accessible within a five-minute walk from a given location, as well as the density of buildings (of varying ages and conditions) and short blocks, are associated with more even footfall throughout the day. Our analysis also indicates some potential negative trade-offs from dense and mixed-use neighbourhoods, such as being associated with more continuous road traffic throughout the day. Our methodological approach is scalable and adaptable to different modes of image data capture and can be widely adopted in other cities worldwide.
 Paper
Inequalities in urban air pollution in sub-Saharan Africa: an empirical modeling of ambient NO and NO2 concentrations in Accra, Ghana
Paper
Inequalities in urban air pollution in sub-Saharan Africa: an empirical modeling of ambient NO and NO2 concentrations in Accra, Ghana
Environmental Research Letters
2024
Abstract
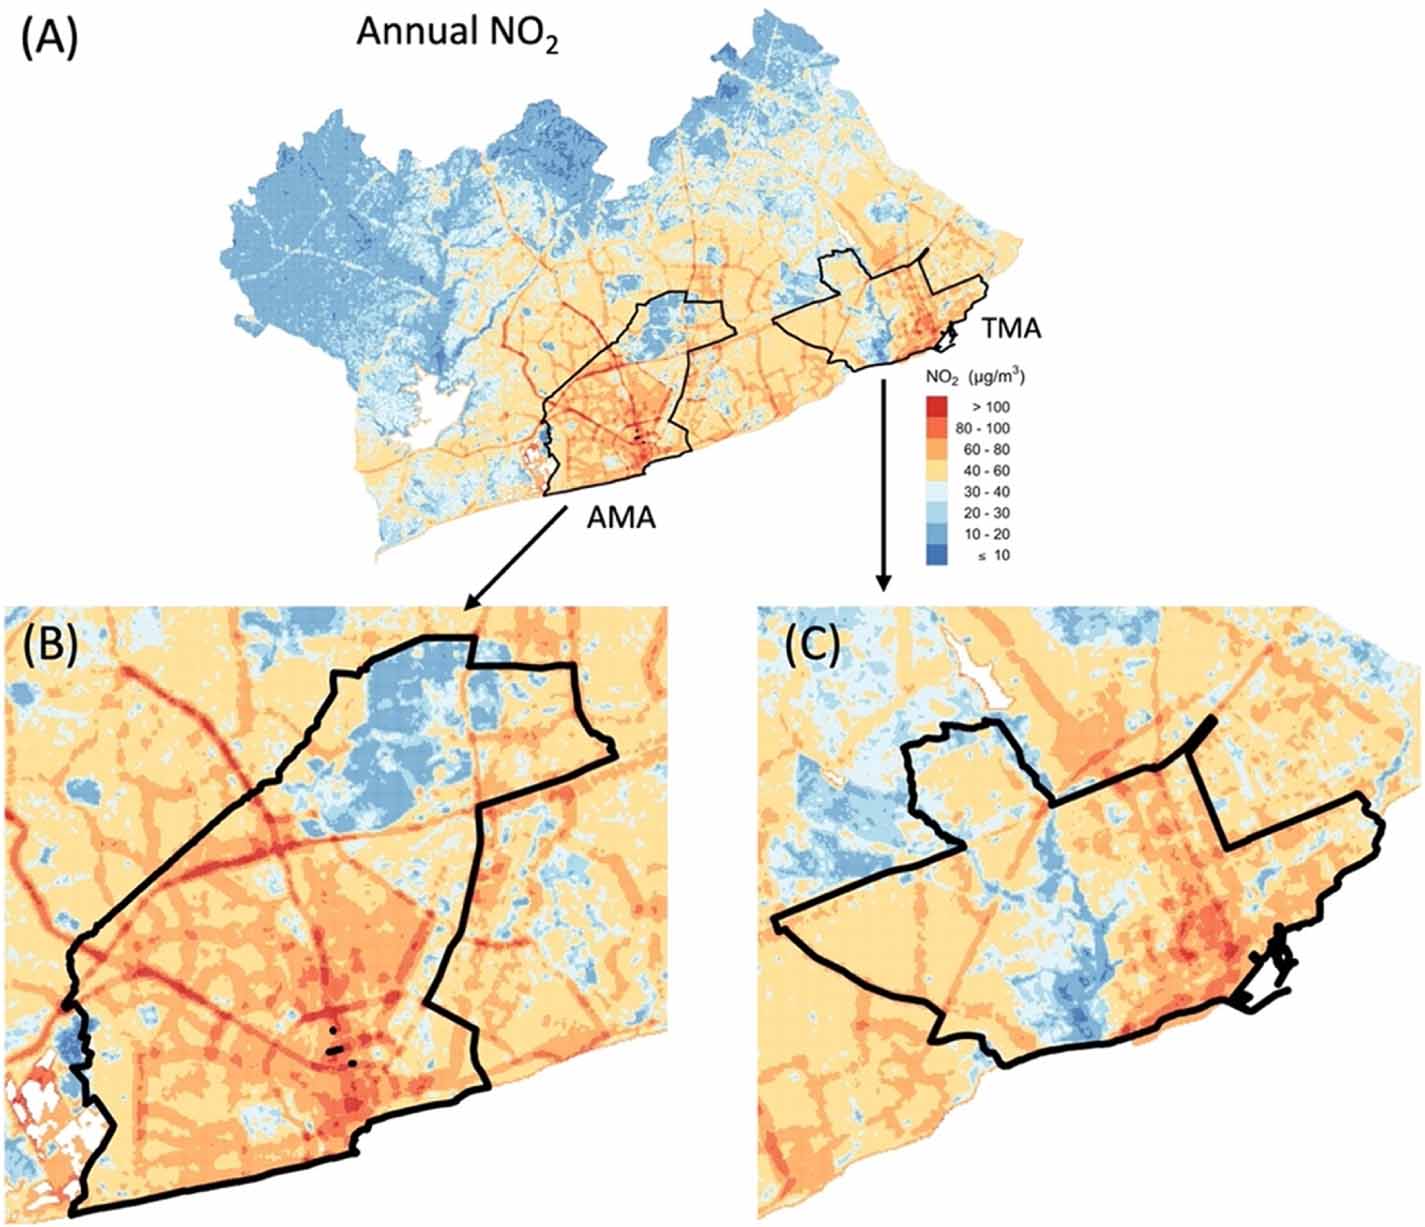
Road traffic has become the leading source of air pollution in fast-growing sub-Saharan African cities. Yet, there is a dearth of robust city-wide data for understanding space-time variations and inequalities in combustion related emissions and exposures. We combined nitrogen dioxide (NO2) and nitric oxide (NO) measurement data from 134 locations in the Greater Accra Metropolitan Area (GAMA), with geographical, meteorological, and population factors in spatio-temporal mixed effects models to predict NO2 and NO concentrations at fine spatial (50 m) and temporal (weekly) resolution over the entire GAMA. Model performance was evaluated with 10-fold cross-validation (CV), and predictions were summarized as annual and seasonal (dusty [Harmattan] and rainy [non-Harmattan]) mean concentrations. The predictions were used to examine population distributions of, and socioeconomic inequalities in, exposure at the census enumeration area (EA) level. The models explained 88% and 79% of the spatiotemporal variability in NO2 and NO concentrations, respectively. The mean predicted annual, non-Harmattan and Harmattan NO2 levels were 37 (range: 1–189), 28 (range: 1–170) and 50 (range: 1–195) µg m−3, respectively. Unlike NO2, NO concentrations were highest in the non-Harmattan season (41 [range: 31–521] µg m−3). Road traffic was the dominant factor for both pollutants, but NO2 had higher spatial heterogeneity than NO. For both pollutants, the levels were substantially higher in the city core, where the entire population (100%) was exposed to annual NO2 levels exceeding the World Health Organization (WHO) guideline of 10 µg m−3. Significant disparities in NO2 concentrations existed across socioeconomic gradients, with residents in the poorest communities exposed to levels about 15 µg m−3 higher compared with the wealthiest (p < 0.001). The results showed the important role of road traffic emissions in air pollution concentrations in the GAMA, which has major implications for the health of the city’s poorest residents. These data could support climate and health impact assessments as well as policy evaluations in the city.
 Paper · First author
Beyond here and now: Evaluating pollution estimation across space and time from street view images with deep learning
Paper · First author
Beyond here and now: Evaluating pollution estimation across space and time from street view images with deep learning
Science of The Total Environment
2023
Abstract
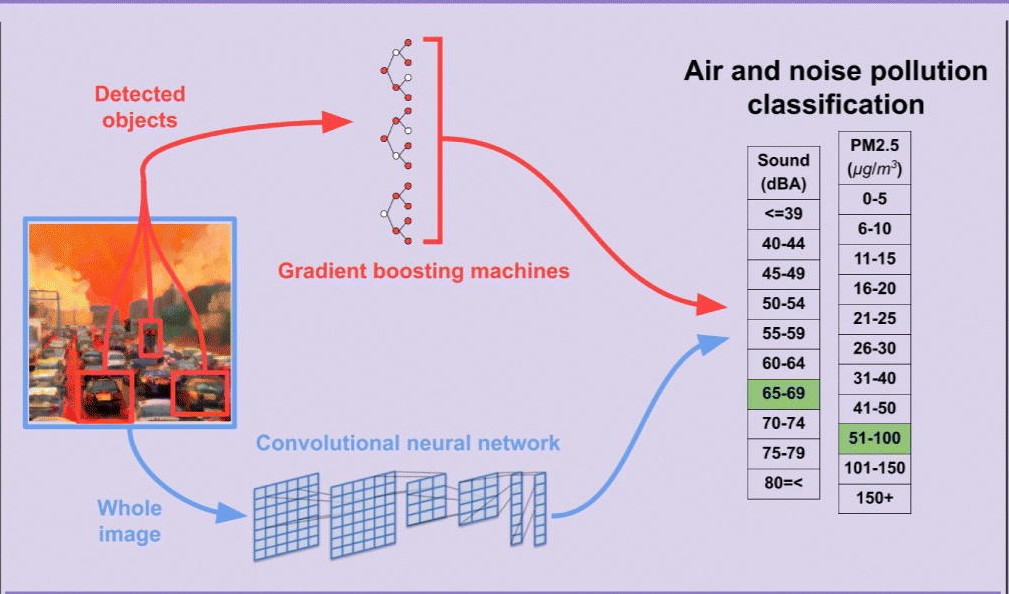
Advances in computer vision, driven by deep learning, allows for the inference of environmental pollution and its potential sources from images. The spatial and temporal generalisability of image-based pollution models is crucial in their real-world application, but is currently understudied, particularly in low-income countries where infrastructure for measuring the complex patterns of pollution is limited and modelling may therefore provide the most utility. We employed convolutional neural networks (CNNs) for two complementary classification models, in both an end-to-end approach and as an interpretable feature extractor (object detection), to estimate spatially and temporally resolved fine particulate matter (PM2.5) and noise levels in Accra, Ghana. Data used for training the models were from a unique dataset of over 1.6 million images collected over 15 months at 145 representative locations across the city, paired with air and noise measurements. Both end-to-end CNN and object-based approaches surpassed null model benchmarks for predicting PM2.5 and noise at single locations, but performance deteriorated when applied to other locations. Model accuracy diminished when tested on images from locations unseen during training, but improved by sampling a greater number of locations during model training, even if the total quantity of data was reduced. The end-to-end models used characteristics of images associated with atmospheric visibility for predicting PM2.5, and specific objects such as vehicles and people for noise. The results demonstrate the potential and challenges of image-based, spatiotemporal air pollution and noise estimation, and that robust, environmental modelling with images requires integration with traditional sensor networks.
 Paper
Do poverty and wealth look the same the world over? A comparative study of 12 cities from five high-income countries using street images
Paper
Do poverty and wealth look the same the world over? A comparative study of 12 cities from five high-income countries using street images
EPJ Data Science
2023
Abstract
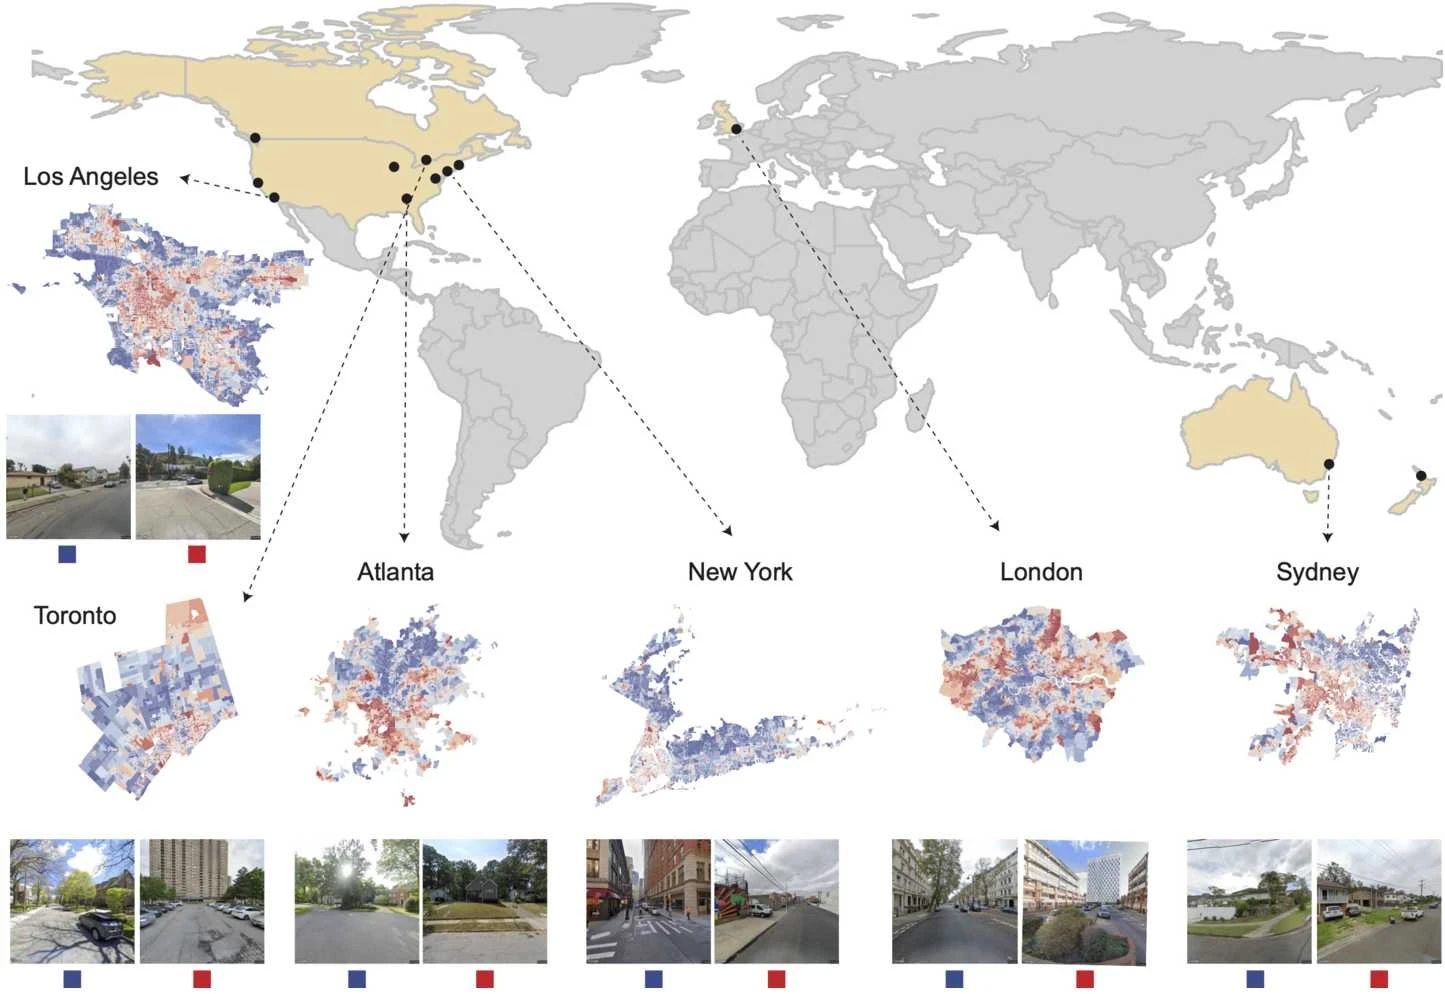
Urbanization and inequalities are two of the major policy themes of our time, intersecting in large cities where social and economic inequalities are particularly pronounced. Large scale street-level images are a source of city-wide visual information and allow for comparative analyses of multiple cities. Computer vision methods based on deep learning applied to street images have been shown to successfully measure inequalities in socioeconomic and environmental features, yet existing work has been within specific geographies and have not looked at how visual environments compare across different cities and countries. In this study, we aim to apply existing methods to understand whether, and to what extent, poor and wealthy groups live in visually similar neighborhoods across cities and countries. We present novel insights on similarity of neighborhoods using street-level images and deep learning methods. We analyzed 7.2 million images from 12 cities in five high-income countries, home to more than 85 million people: Auckland (New Zealand), Sydney (Australia), Toronto and Vancouver (Canada), Atlanta, Boston, Chicago, Los Angeles, New York, San Francisco, and Washington D.C. (United States of America), and London (United Kingdom). Visual features associated with neighborhood disadvantage are more distinct and unique to each city than those associated with affluence. For example, from what is visible from street images, high density poor neighborhoods located near the city center (e.g., in London) are visually distinct from poor suburban neighborhoods characterized by lower density and lower accessibility (e.g., in Atlanta). This suggests that differences between two cities is also driven by historical factors, policies, and local geography. Our results also have implications for image-based measures of inequality in cities especially when trained on data from cities that are visually distinct from target cities. We showed that these are more prone to errors for disadvantaged areas especially when transferring across cities, suggesting more attention needs to be paid to improving methods for capturing heterogeneity in poor environment across cities around the world.
 Paper
Phenotyping urban built and natural environments with high-resolution satellite images and unsupervised deep learning
Paper
Phenotyping urban built and natural environments with high-resolution satellite images and unsupervised deep learning
Science of The Total Environment
2023
Abstract
Cities in the developing world are expanding rapidly, and undergoing changes to their roads, buildings, vegetation, and other land use characteristics. Timely data are needed to ensure that urban change enhances health, wellbeing and sustainability. We present and evaluate a novel unsupervised deep clustering method to classify and characterise the complex and multidimensional built and natural environments of cities into interpretable clusters using high-resolution satellite images. We applied our approach to a high-resolution (0.3 m/pixel) satellite image of Accra, Ghana, one of the fastest growing cities in sub-Saharan Africa, and contextualised the results with demographic and environmental data that were not used for clustering. We show that clusters obtained solely from images capture distinct interpretable phenotypes of the urban natural (vegetation and water) and built (building count, size, density, and orientation; length and arrangement of roads) environment, and population, either as a unique defining characteristic (e.g., bodies of water or dense vegetation) or in combination (e.g., buildings surrounded by vegetation or sparsely populated areas intermixed with roads). Clusters that were based on a single defining characteristic were robust to the spatial scale of analysis and the choice of cluster number, whereas those based on a combination of characteristics changed based on scale and number of clusters. The results demonstrate that satellite data and unsupervised deep learning provide a cost-effective, interpretable and scalable approach for real-time tracking of sustainable urban development, especially where traditional environmental and demographic data are limited and infrequent.
 Paper
Changes in life expectancy and house prices in London from 2002 to 2019: hyper-resolution spatiotemporal analysis of death registration and real estate data
Paper
Changes in life expectancy and house prices in London from 2002 to 2019: hyper-resolution spatiotemporal analysis of death registration and real estate data
The Lancet Regional Health - Europe
2023
Abstract
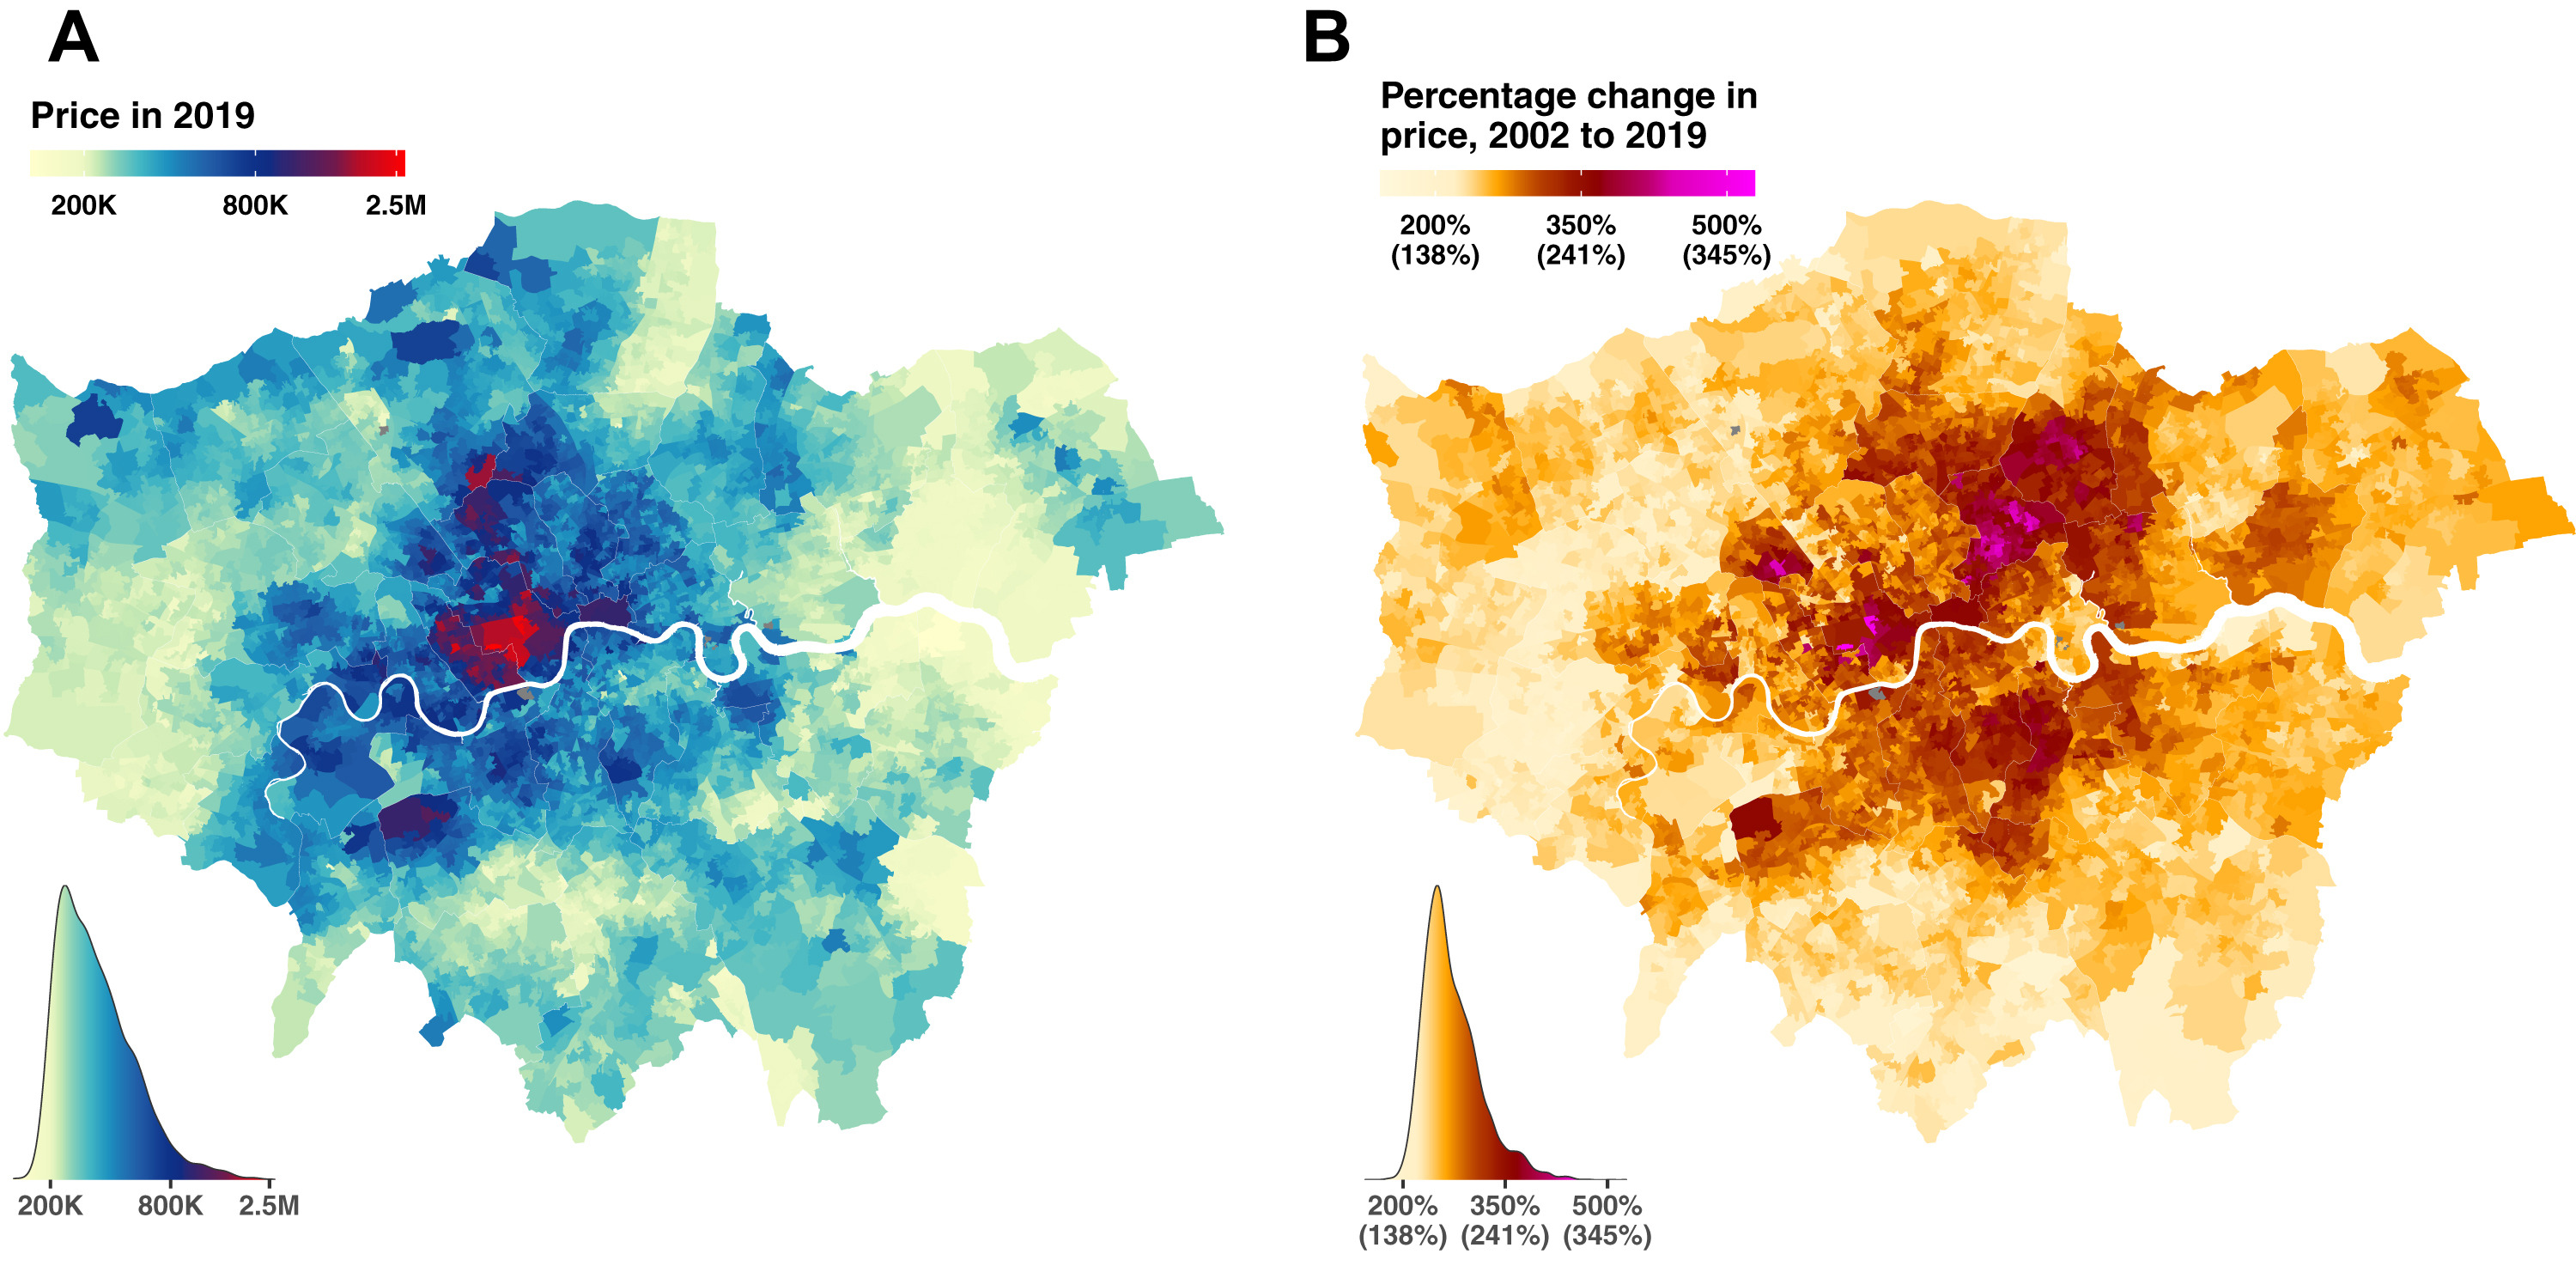
Background London has outperformed smaller towns and rural areas in terms of life expectancy increase. Our aim was to investigate life expectancy change at very-small-area level, and its relationship with house prices and their change. Methods We performed a hyper-resolution spatiotemporal analysis from 2002 to 2019 for 4835 London Lower-layer Super Output Areas (LSOAs). We used population and death counts in a Bayesian hierarchical model to estimate age- and sex-specific death rates for each LSOA, converted to life expectancy at birth using life table methods. We used data from the Land Registry via the real estate website Rightmove (www.rightmove.co.uk), with information on property size, type and land tenure in a hierarchical model to estimate house prices at LSOA level. We used linear regressions to summarise how much life expectancy changed in relation to the combination of house prices in 2002 and their change from 2002 to 2019. We calculated the correlation between change in price and change in sociodemographic characteristics of the resident population of LSOAs and population turnover. Findings In 134 (2.8%) of London's LSOAs for women and 32 (0.7%) for men, life expectancy may have declined from 2002 to 2019, with a posterior probability of a decline >80% in 41 (0.8%, women) and 14 (0.3%, men) LSOAs. The life expectancy increase in other LSOAs ranged from <2 years in 537 (11.1%) LSOAs for women and 214 (4.4%) for men to >10 years in 220 (4.6%) for women and 211 (4.4%) for men. The 2.5th-97.5th-percentile life expectancy difference across LSOAs increased from 11.1 (10.7–11.5) years in 2002 to 19.1 (18.4–19.7) years for women in 2019, and from 11.6 (11.3–12.0) years to 17.2 (16.7–17.8) years for men. In the 20% (men) and 30% (women) of LSOAs where house prices had been lowest in 2002, mainly in east and outer west London, life expectancy increased only in proportion to the rise in house prices. In contrast, in the 30% (men) and 60% (women) most expensive LSOAs in 2002, life expectancy increased solely independently of price change. Except for the 20% of LSOAs that had been most expensive in 2002, LSOAs with larger house price increases experienced larger growth in their population, especially among people of working ages (30–69 years), had a larger share of households who had not lived there in 2002, and improved their rankings in education, poverty and employment. Interpretation Large gains in area life expectancy in London occurred either where house prices were already high, or in areas where house prices grew the most. In the latter group, the increases in life expectancy may be driven, in part, by changing population demographics. Funding Wellcome Trust; UKRI (MRC); Imperial College London; National Institutes of Health Research.
 Paper
Using Deep Learning and Google Street View Imagery to Assess and Improve Cyclist Safety in London
Paper
Using Deep Learning and Google Street View Imagery to Assess and Improve Cyclist Safety in London
Sustainability
2023
Abstract
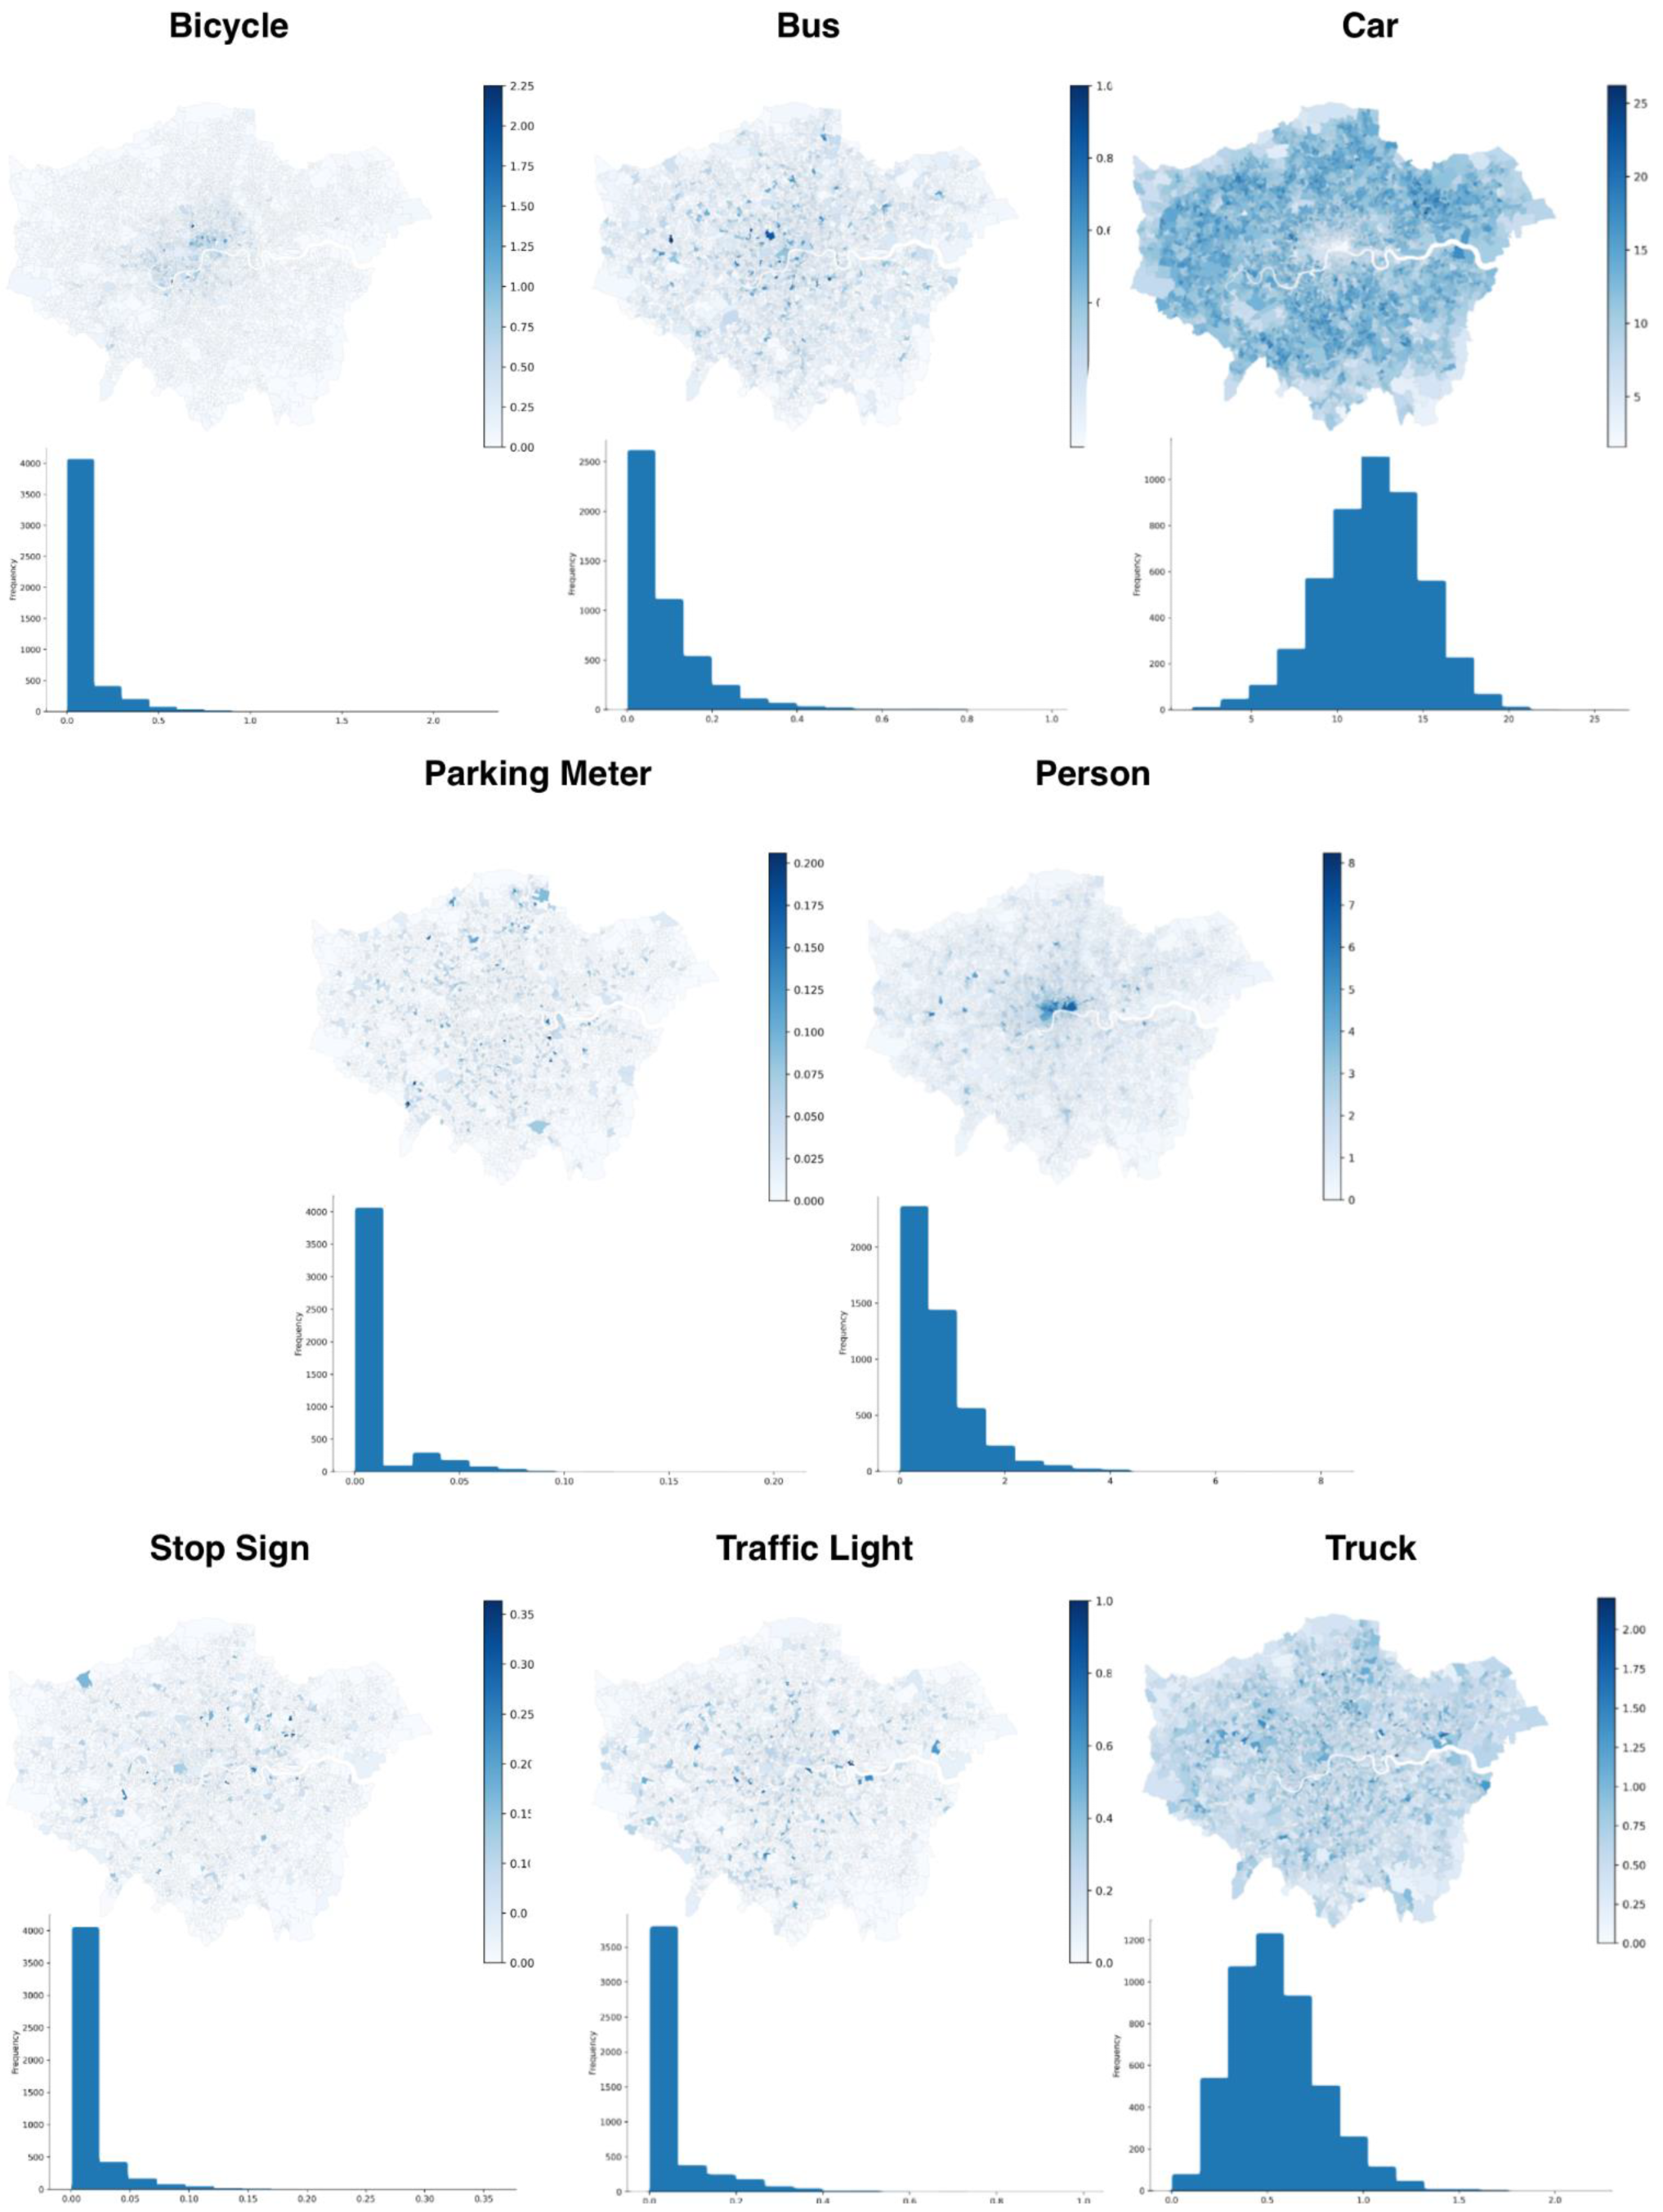
Cycling is a sustainable mode of transportation with significant benefits for society. The number of cyclists on the streets depends heavily on their perception of safety, which makes it essential to establish a common metric for determining and comparing risk factors related to road safety. This research addresses the identification of cyclists’ risk factors using deep learning techniques applied to a Google Street View (GSV) imagery dataset. The research utilizes a case study approach, focusing on London, and applies object detection and image segmentation models to extract cyclists’ risk factors from GSV images. Two state-of-the-art tools, You Only Look Once version 5 (YOLOv5) and the pyramid scene parsing network (PSPNet101), were used for object detection and image segmentation. This study analyzes the results and discusses the technology’s limitations and potential for improvements in assessing cyclist safety. Approximately 2 million objects were identified, and 250 billion pixels were labeled in the 500,000 images available in the dataset. On average, 108 images were analyzed per Lower Layer Super Output Area (LSOA) in London. The distribution of risk factors, including high vehicle speed, tram/train rails, truck circulation, parked cars and the presence of pedestrians, was identified at the LSOA level using YOLOv5. Statistically significant negative correlations were found between cars and buses, cars and cyclists, and cars and people. In contrast, positive correlations were observed between people and buses and between people and bicycles. Using PSPNet101, building (19%), sky (15%) and road (15%) pixels were the most common. The findings of this research have the potential to contribute to a better understanding of risk factors for cyclists in urban environments and provide insights for creating safer cities for cyclists by applying deep learning techniques.
 Paper · First author
Characterisation of urban environment and activity across space and time using street images and deep learning in Accra
Paper · First author
Characterisation of urban environment and activity across space and time using street images and deep learning in Accra
Scientific Reports
2022
Abstract
The urban environment influences human health, safety and wellbeing. Cities in Africa are growing faster than other regions but have limited data to guide urban planning and policies. Our aim was to use smart sensing and analytics to characterise the spatial patterns and temporal dynamics of features of the urban environment relevant for health, liveability, safety and sustainability. We collected a novel dataset of 2.1 million time-lapsed day and night images at 145 representative locations throughout the Metropolis of Accra, Ghana. We manually labelled a subset of 1,250 images for 20 contextually relevant objects and used transfer learning with data augmentation to retrain a convolutional neural network to detect them in the remaining images. We identified 23.5 million instances of these objects including 9.66 million instances of persons (41% of all objects), followed by cars (4.19 million, 18%), umbrellas (3.00 million, 13%), and informally operated minibuses known as tro tros (2.94 million, 13%). People, large vehicles and market-related objects were most common in the commercial core and densely populated informal neighbourhoods, while refuse and animals were most observed in the peripheries. The daily variability of objects was smallest in densely populated settlements and largest in the commercial centre. Our novel data and methodology shows that smart sensing and analytics can inform planning and policy decisions for making cities more liveable, equitable, sustainable and healthy.
 Paper
City-Wide Perceptions of Neighbourhood Quality using Street View Images
Paper
City-Wide Perceptions of Neighbourhood Quality using Street View Images
arXiv.org
2022
Abstract
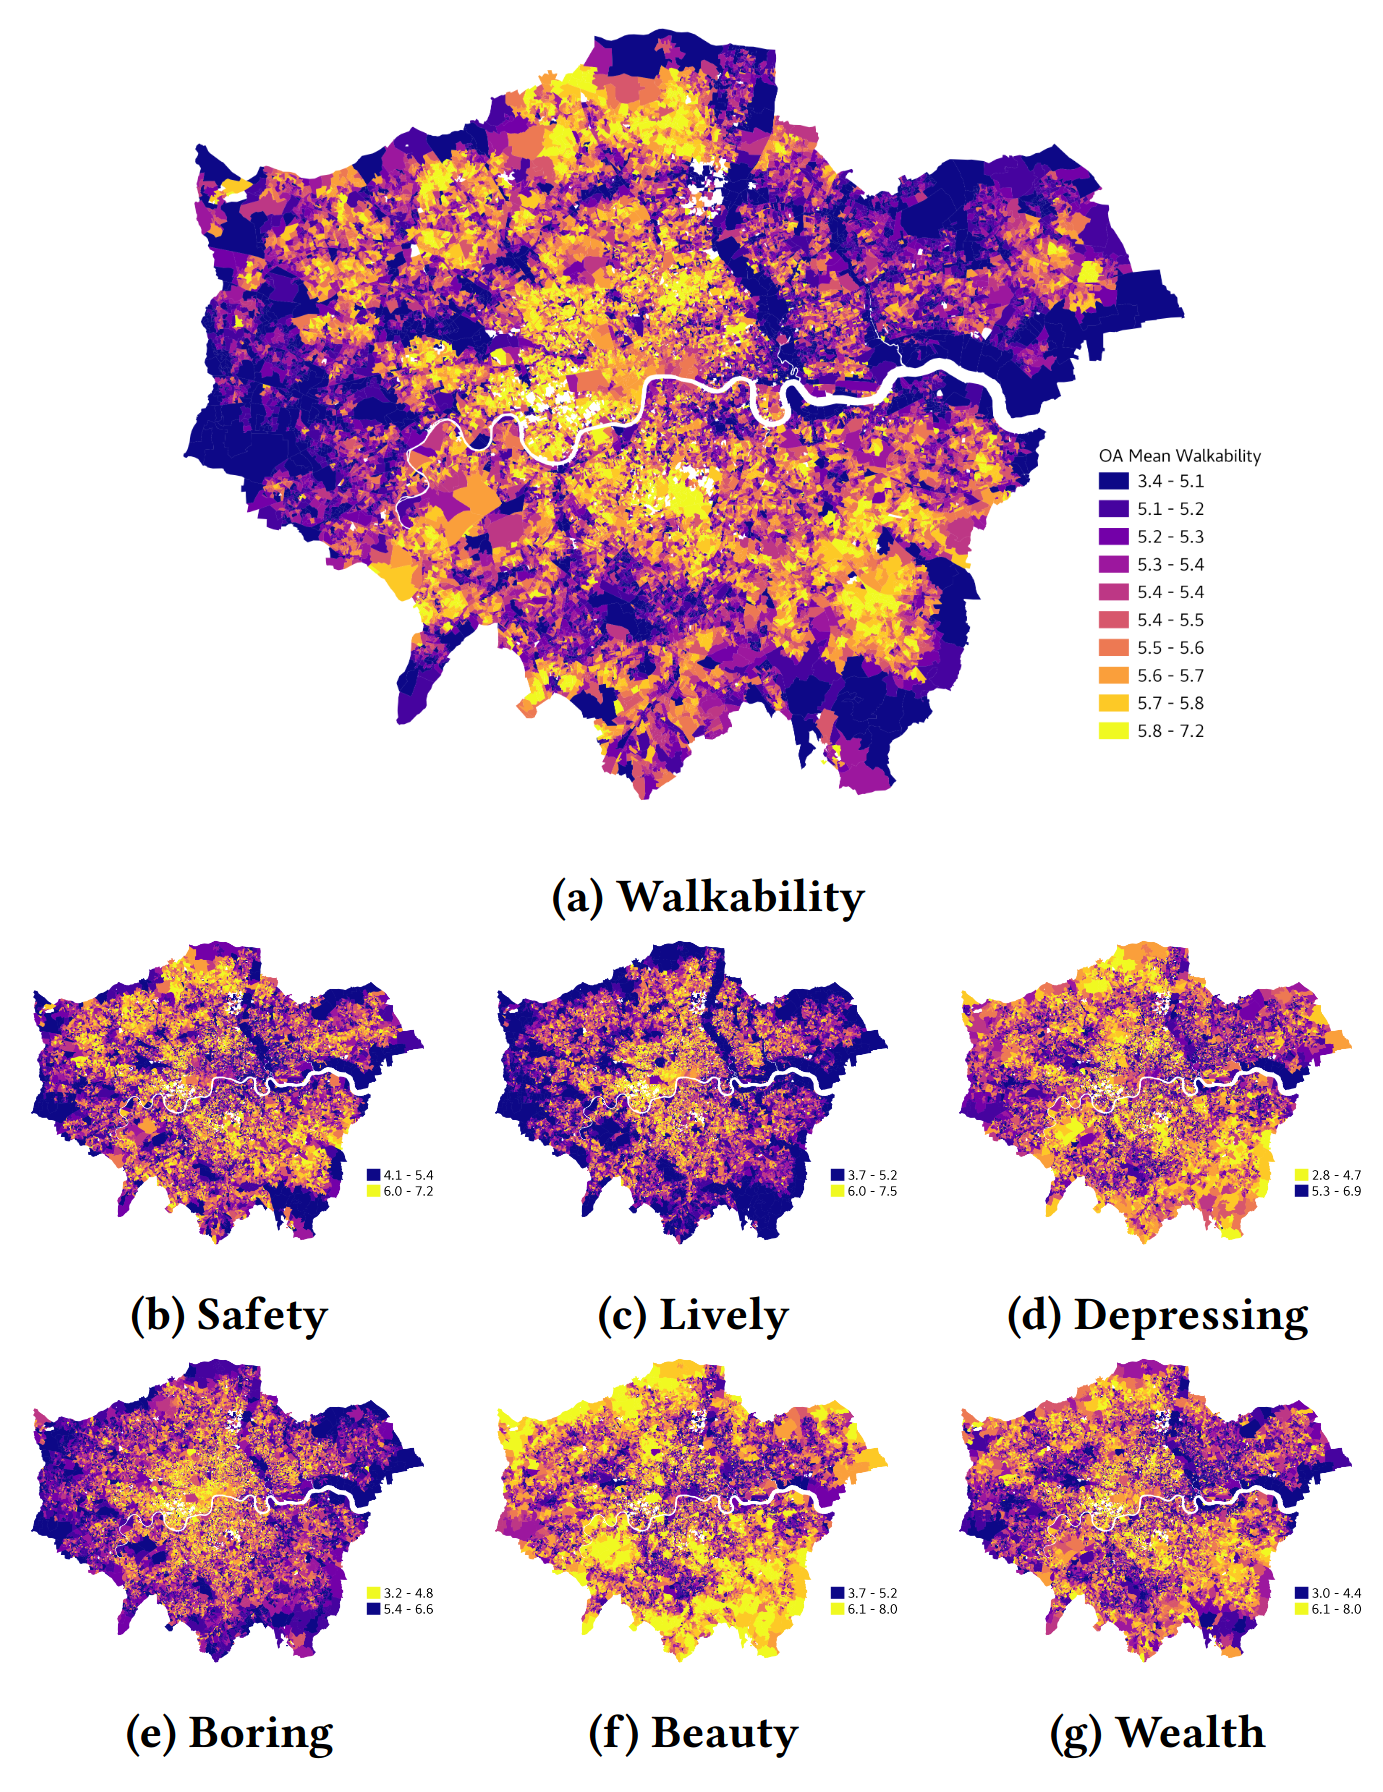
The interactions of individuals with city neighbourhoods is determined, in part, by the perceived quality of urban environments. Perceived neighbourhood quality is a core component of urban vitality, influencing social cohesion, sense of community, safety, activity and mental health of residents. Large-scale assessment of perceptions of neighbourhood quality was pioneered by the Place Pulse projects. Researchers demonstrated the efficacy of crowd-sourcing perception ratings of image pairs across 56 cities and training a model to predict perceptions from street-view images. Variation across cities may limit Place Pulse's usefulness for assessing within-city perceptions. In this paper, we set forth a protocol for city-specific dataset collection for the perception: 'On which street would you prefer to walk?'. This paper describes our methodology, based in London, including collection of images and ratings, web development, model training and mapping. Assessment of within-city perceptions of neighbourhoods can identify inequities, inform planning priorities, and identify temporal dynamics. Code available: https://emilymuller1991.github.io/urban-perceptions/.
 Paper
Space-time characterization of community noise and sound sources in Accra, Ghana
Paper
Space-time characterization of community noise and sound sources in Accra, Ghana
Scientific Reports
2021
Abstract
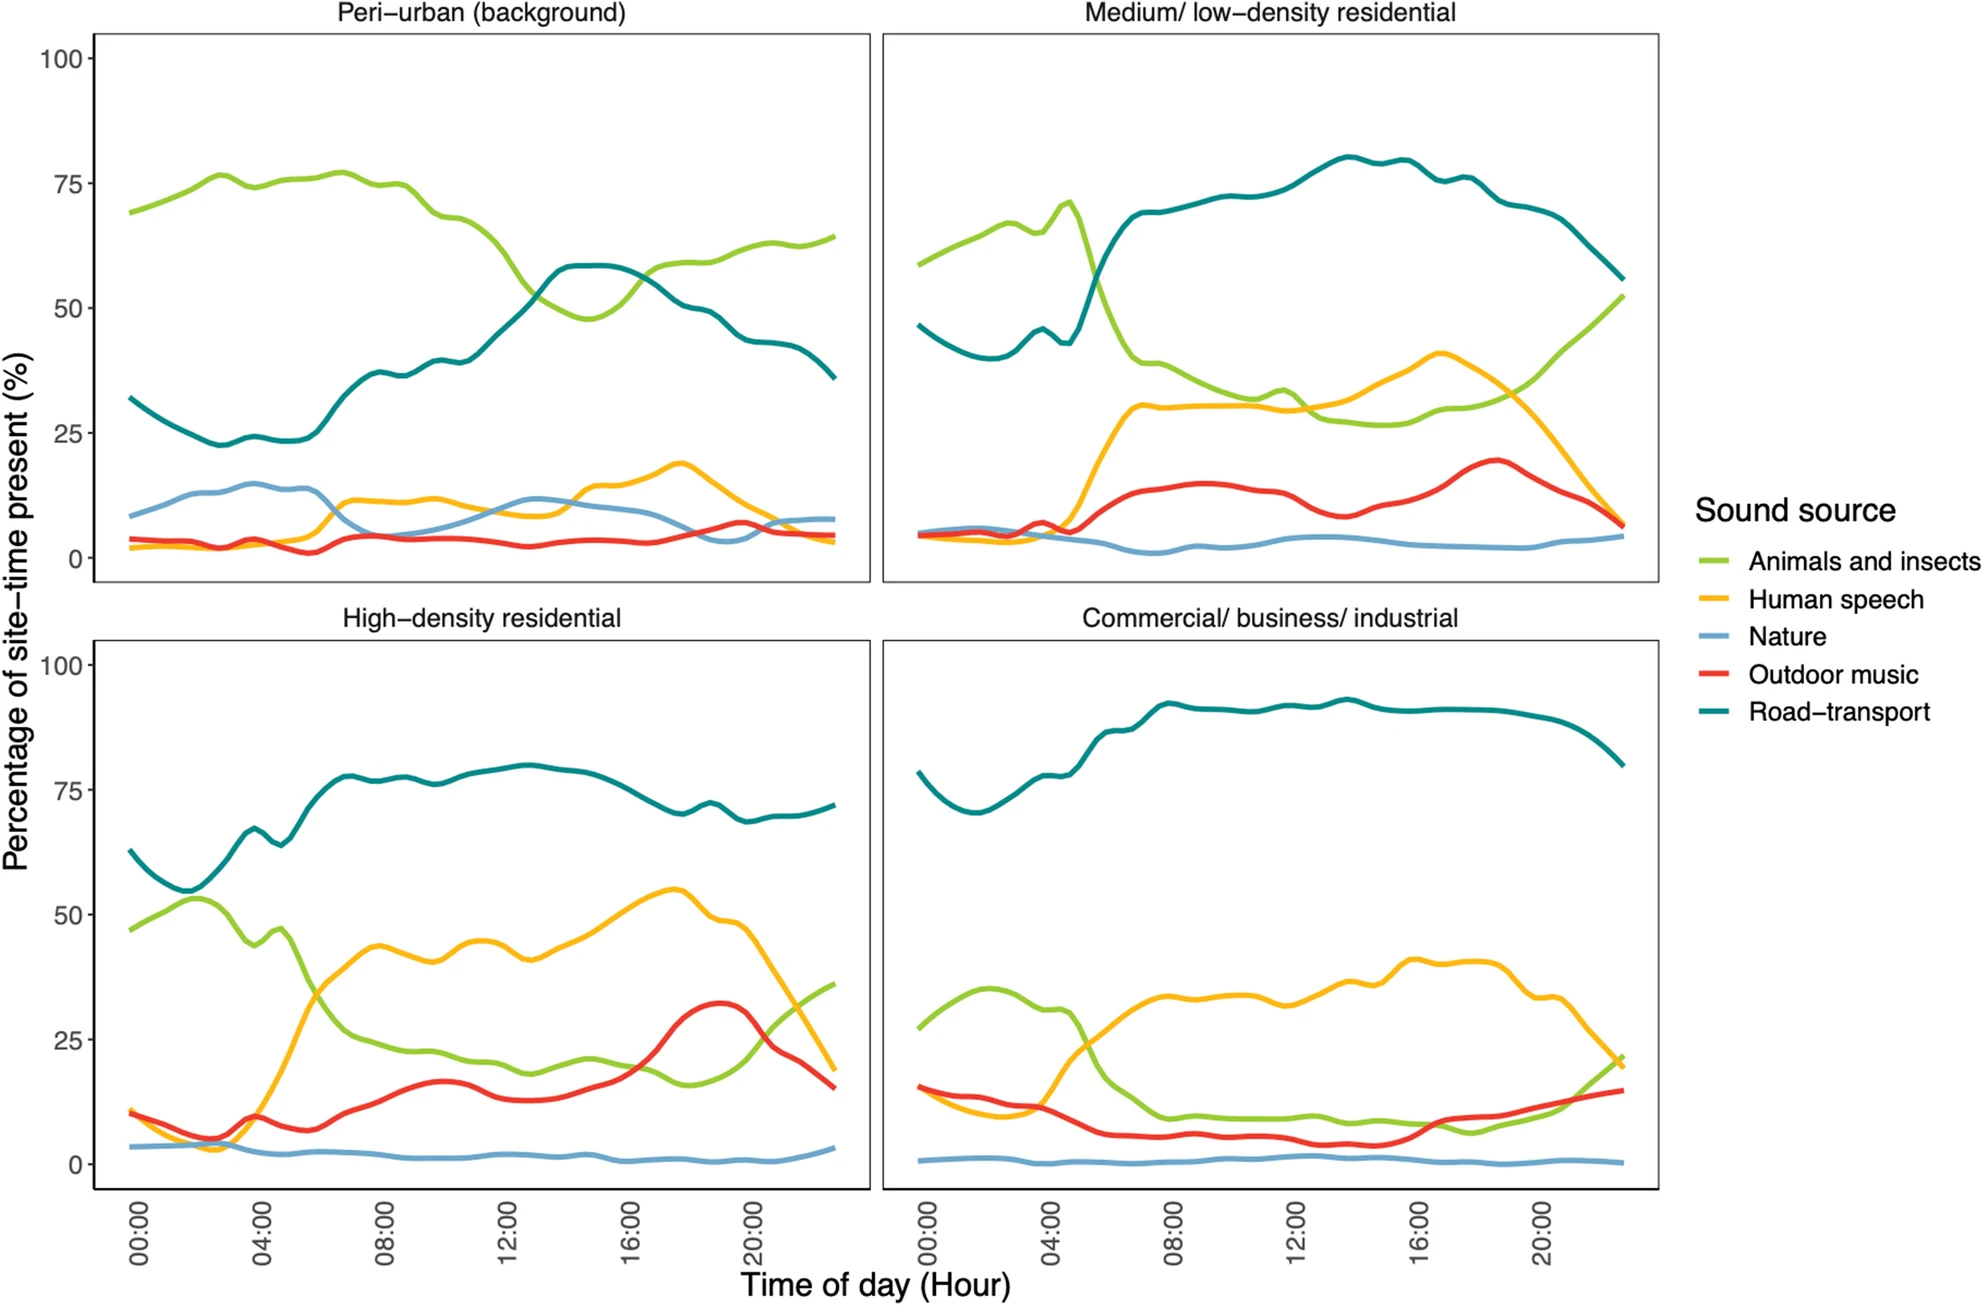
Urban noise pollution is an emerging public health concern in growing cities in sub-Saharan Africa (SSA), but the sound environment in SSA cities is understudied. We leveraged a large-scale measurement campaign to characterize the spatial and temporal patterns of measured sound levels and sound sources in Accra, Ghana. We measured sound levels and recorded audio clips at 146 representative locations, involving 7-days (136 locations) and 1-year measurements between 2019 and 2020. We calculated metrics of noise levels and intermittency and analyzed audio recordings using a pre-trained neural network to identify sources. Commercial, business, and industrial areas and areas near major roads had the highest median daily sound levels (LAeq24hr: 69 dBA and 72 dBA) and the lowest percentage of intermittent sound; the vice-versa was found for peri urban areas. Road-transport sounds dominated the overall sound environment but mixtures of other sound sources, including animals, human speech, and outdoor music, dominated in various locations and at different times. Environmental noise levels in Accra exceeded both international and national health-based guidelines. Detailed information on the acoustical environmental quality (including sound levels and types) in Accra may guide environmental policy formulation and evaluation to improve the health of urban residents.
 Paper
High-resolution spatiotemporal measurement of air and environmental noise pollution in Sub-Saharan African cities: Pathways to Equitable Health Cities Study protocol for Accra, Ghana
Paper
High-resolution spatiotemporal measurement of air and environmental noise pollution in Sub-Saharan African cities: Pathways to Equitable Health Cities Study protocol for Accra, Ghana
BMJ Open
2020
Abstract
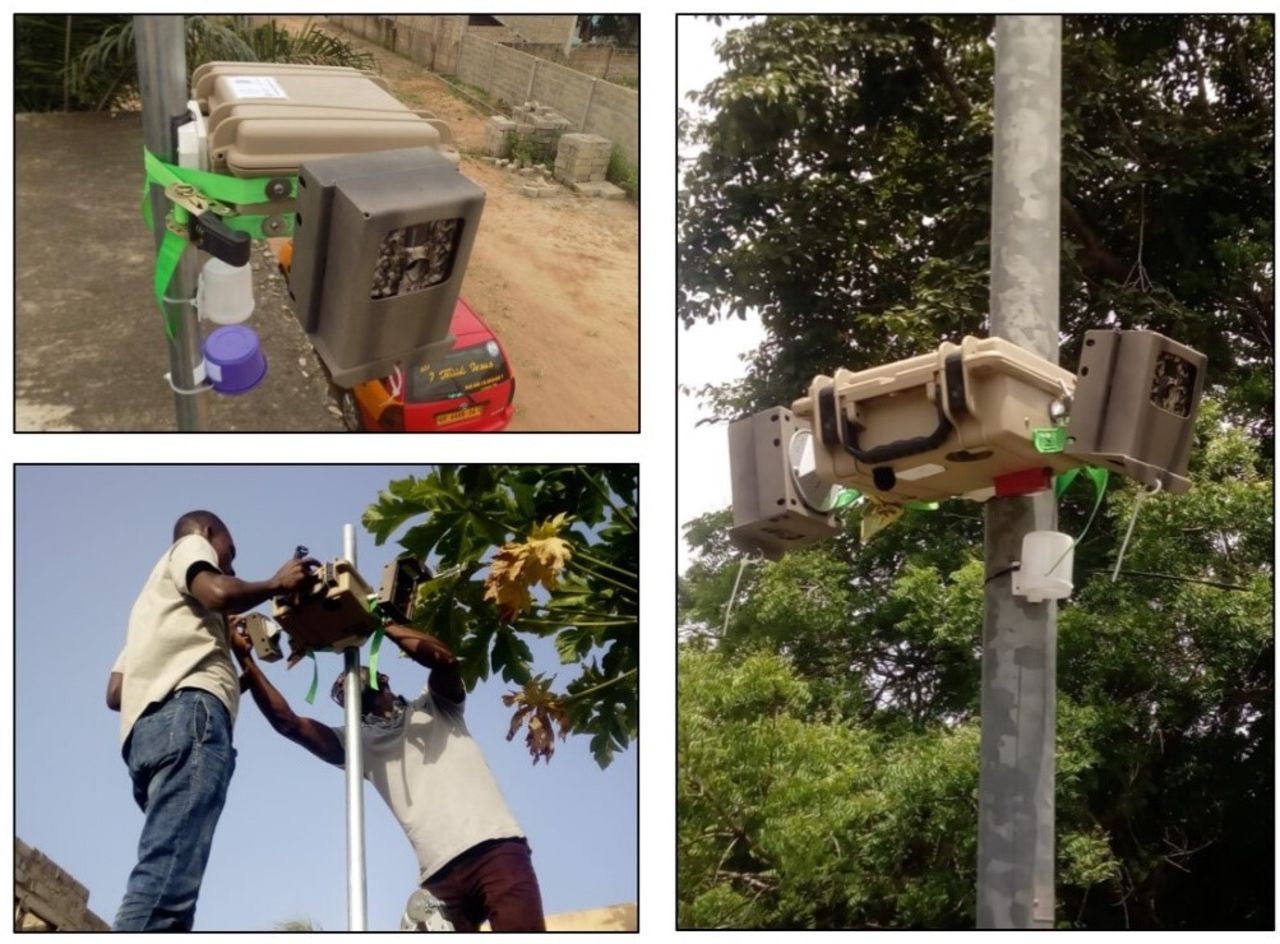
Introduction Air and noise pollution are emerging environmental health hazards in African cities, with potentially complex spatial and temporal patterns. Limited local data are a barrier to the formulation and evaluation of policies to reduce air and noise pollution. Methods and analysis We designed a year-long measurement campaign to characterise air and noise pollution and their sources at high-resolution within the Greater Accra Metropolitan Area (GAMA), Ghana. Our design uses a combination of fixed (year-long, n=10) and rotating (week-long, n =~130) sites, selected to represent a range of land uses and source influences (eg, background, road traffic, commercial, industrial and residential areas, and various neighbourhood socioeconomic classes). We will collect data on fine particulate matter (PM2.5), nitrogen oxides (NOx), weather variables, sound (noise level and audio) along with street-level time-lapse images. We deploy low-cost, low-power, lightweight monitoring devices that are robust, socially unobtrusive, and able to function in Sub-Saharan African (SSA) climate. We will use state-of-the-art methods, including spatial statistics, deep/machine learning, and processed-based emissions modelling, to capture highly resolved temporal and spatial variations in pollution levels across the GAMA and to identify their potential sources. This protocol can serve as a prototype for other SSA cities. Ethics and dissemination This environmental study was deemed exempt from full ethics review at Imperial College London and the University of Massachusetts Amherst; it was approved by the University of Ghana Ethics Committee (ECH 149/18-19). This protocol is designed to be implementable in SSA cities to map environmental pollution to inform urban planning decisions to reduce health harming exposures to air and noise pollution. It will be disseminated through local stakeholder engagement (public and private sectors), peer-reviewed publications, contribution to policy documents, media, and conference presentations.
 Paper · First author
Ad Lucem: QED parton distribution functions in the MMHT framework
Paper · First author
Ad Lucem: QED parton distribution functions in the MMHT framework
The European Physical Journal C
2019
Abstract
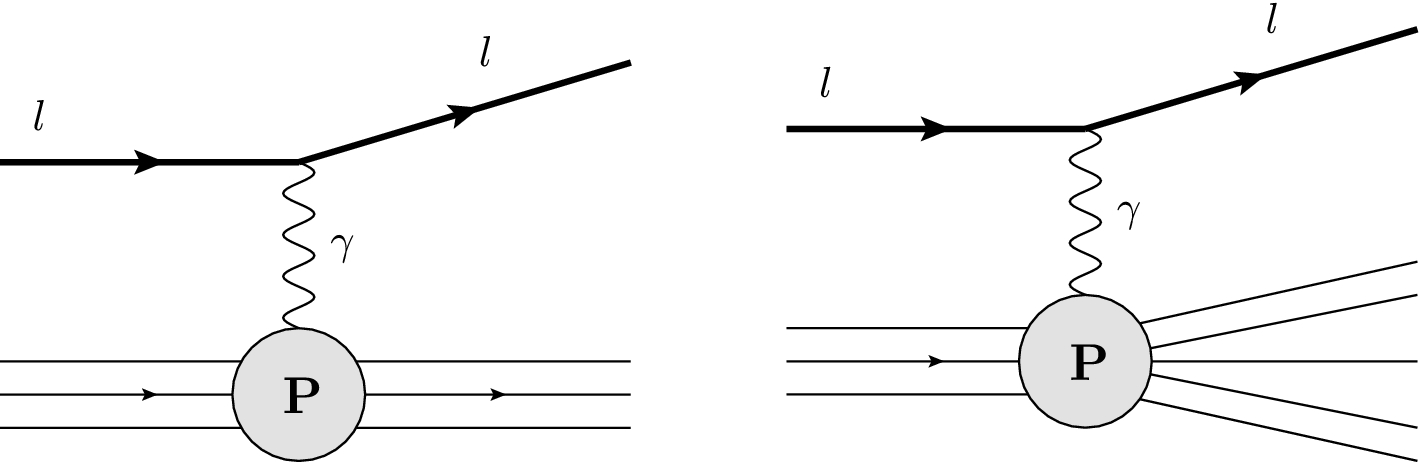
We present the MMHT2015qed PDF set, resulting from the inclusion of QED corrections to the existing set of MMHT Parton Distribution Functions (PDFs), and which contain the photon PDF of the proton. Adopting an input distribution from the LUXqed formulation, we discuss our methods of including QED effects for the full, coupled DGLAP evolution of all partons with QED at O(α), O(ααS), O(α2). While we find consistency for the photon PDF of the proton with other recent sets, building on this we also present a set of QED corrected neutron PDFs and provide the photon PDF separated into its elastic and inelastic contributions. The effect of QED corrections on the other partons and the fit quality is investigated, and the sources of uncertainty for the photon are outlined. Finally we explore the phenomenological implications of this set, giving the partonic luminosities for both the elastic and inelastic contributions to the photon and the effect of our photon PDF on fits to high mass Drell–Yan production, including the photon-initiated channel.
 Paper
Compression of X-ray Free Electron Laser Pulses to Attosecond Duration
Paper
Compression of X-ray Free Electron Laser Pulses to Attosecond Duration
Scientific Reports
2015
Abstract
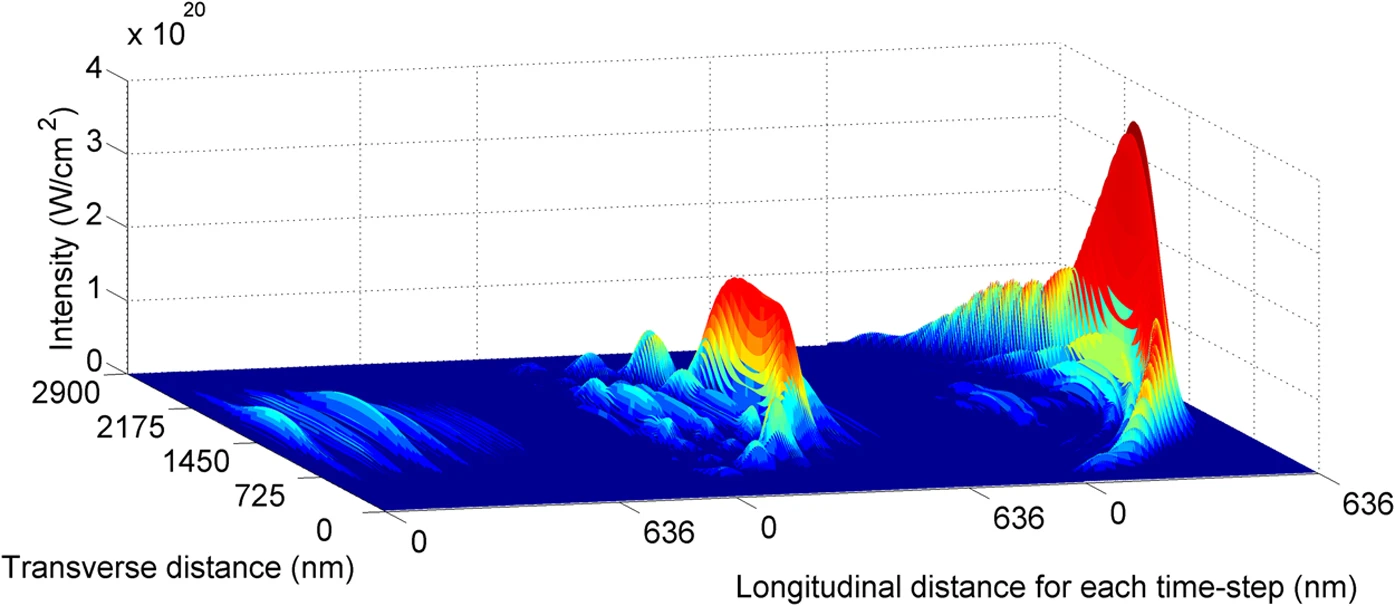
State of the art X-ray Free Electron Laser facilities currently provide the brightest X-ray pulses available, typically with mJ energy and several hundred femtosecond duration. Here we present one- and two-dimensional Particle-in-Cell simulations, utilising the process of stimulated Raman amplification, showing that these pulses are compressed to a temporally coherent, sub-femtosecond pulse at 8% efficiency. Pulses of this type may pave the way for routine time resolution of electrons in nm size potentials. Furthermore, evidence is presented that significant Landau damping and wave-breaking may be beneficial in distorting the rear of the interaction and further reducing the final pulse duration.